The 2016 elections called into question the accuracy of public opinion polling while tapping into new streams of public opinion more widely. The third edition of this well-established text addresses these questions and adds new perspectives to its authoritative line-up. The hallmark of this book is making cutting-edge research accessible and understandable to students and general readers. Here we see a variety of disciplinary approaches to public opinion reflected including psychology, economics, sociology, and biology in addition to political science. An emphasis on race, gender, and new media puts the elections of 2016 into context and prepares students to look ahead to 2020 and beyond.
New to the third edition:
• Includes 2016 election results and their implications for public opinion polling going forward.
• Three new chapters have been added on racializing politics, worldview politics, and the modern information environment.
• New authors include Shanto Iyengar, Michael Tesler, Vladimir E. Medenica, Erin Cikanek, Danna Young, Jennifer Jerit, and Jake Haselswerdt.
Trusted by 375,005 students
Access to over 1.5 million titles for a fair monthly price.
The 2016 U.S. presidential election understandably rattled public confidence in the polling industry. Pre-election polls and forecasts consistently predicted that Democrat Hillary Clinton would win a resounding victory over Republican Donald Trump, but he surprised the world by winning 56.8 percent of the electoral college vote to capture the presidency. Media headlines asked “Can We Ever Trust the Polls Again?” and pundits suggested that the polling industry was “teetering on the edge of disaster.”1
There is little doubt that polling or survey research has faced increasing methodological challenges in recent years. Surveys rely on the cooperation of people to check boxes and answer questions, yet people today are harder to reach, and when contacted they are less likely to answer questions. At the same time, there has been a proliferation in the amount of polling—from horserace numbers in the newspaper headlines to opt-in “polls” predicting sports outcomes on ESPN.com or judging celebrity outfits in Instyle magazine. With so many polls, it is no wonder that it can be difficult to figure out if polls are trustworthy.
In this chapter, I will outline some of the key methodological challenges in conducting, using, and evaluating surveys as a measure of public opinion. There are three “take-home” messages: First, I will explain why all surveys are not created equal. Some surveys should be trusted more than others, and, unfortunately, it is not sufficient to make assumptions about survey quality based on polling topic (say, politics rather than entertainment), sample size, or sponsorship. The total survey error perspective provides a framework for evaluating how various aspects of the survey method can influence the validity and reliability of the resulting survey statistics. Second, I hope this chapter makes clear that no survey is perfect. While there is significant variation in survey quality, not even our “gold standard” surveys like the American National Election Study should be immune from scrutiny. Finally, I will appeal for journalists and scholars at all levels to provide enough information about their survey methods for readers to assess the knowledge claims being made.
The Data Stork Myth
Despite increasing concerns about survey quality, surveys remain the cornerstone of research on economic, political, and social phenomena across academic, commercial, nonprofit, and government sectors. When properly designed, surveys are a powerful tool for collecting information about the attitudes, characteristics, and behaviors of individuals, households, and organizations. Too often, however, scholars and journalists tend to treat survey data as if they have simply been delivered by a data stork, failing to question where they came from, how they were produced, and by what methodology. Yet a survey involves numerous steps and decisions, and with each one, error can be introduced into the resulting survey statistics. A significant part of the difficulty in establishing survey quality standards is not that our scientific understanding of survey methodology is flawed or inadequate, but rather that scientific research in survey methodology has not permeated the broader community of survey consumers. In the survey methodology literature, scholars have adopted a total survey error perspective that recognizes the need to consider a variety of different types of error in evaluating survey quality.2Figure 1.1, reproduced from Herb Weisberg’s textbook The Total Survey Error Approach, summarizes these various sources of error in the survey process.3 In this chapter, I discuss some of these—sampling error, coverage error, nonresponse error, and measurement error—highlighting specific challenges and controversies. I first provide an overview of the survey process and introduce some key terminology.
Figure 1.1The Tital Survey Error Perspective
A high-quality survey is one that tries to minimize all sources of error within the inevitable time and budgetary constraints of the project. The goal is to produce survey results that are valid and reliable, terms that have specific meaning and usage in scientific research. Validity refers to the accuracy of the results, while reliability refers to consistency or stability in the results if it were to be repeated in identical conditions. Archery offers a common analogy to clarify the difference between the concepts of validity and reliability. Research that is reliable but not valid is like an archer who always hits about the same place but not near the bullseye. Research that is valid but not reliable is like the archer who hits various places centered around the bullseye, but not very accurately. Again, the goal is to be both reliable and valid, like an archer who hits consistently close to the bullseye.
Overview of the Survey Process
When we think of surveys, we often have in mind the resulting survey statistics. For example, a recent news story reported that 61 percent of Americans support legalizing marijuana. This survey statistic about public opinion is the product of a very specific survey process that involves a series of consequential methodological decisions and assumptions. In small print at the end of the article, we find some of that methodological information: “Conducted April 11–April 15, 2017 and based on 1,011 telephone interviews. Sample: National adult. The margin of sampling error is plus or minus 3 percentage points.” In this section, I will outline the basic process involved in reaching conclusions about public opinion on the basis of a smaller sample of respondents.
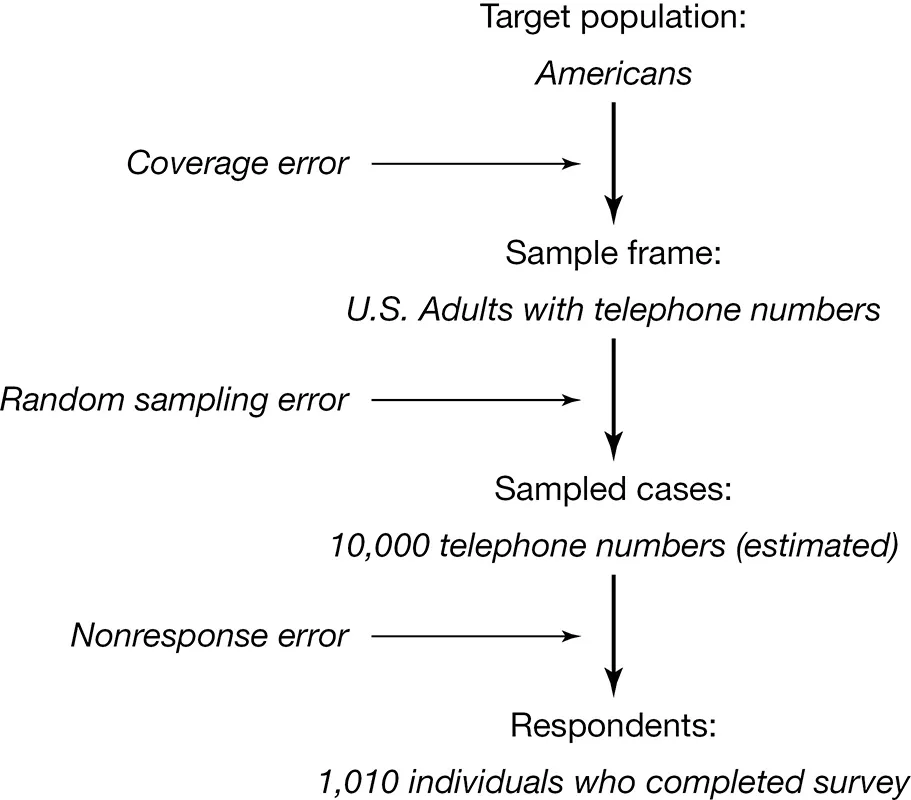
The first step in the survey process is deciding on the target population; that is, the group to whom the survey is intended to generalize. This survey obviously did not ask all Americans their opinion on this issue; rather, they surveyed 1,011 individuals they believed were representative of the broader American public. Their target population was the entire adult US population.4 Many polls, especially pre-election polls, use instead a target population of only adults who are registered to vote. Other surveys are interested in even more specialized populations; for example, a recent survey on alcohol and drug use at Duke University was meant to represent only those undergraduates currently enrolled at the university.
After determining the target population, the next step in the survey process is specifying a sample frame—lists or procedures that identify all elements of the target population. The sample frame may be a list of telephone numbers, maps of areas in which households can be found, or a procedure (like random digit dialing) that could identify the target population. At their simplest, sampling frames just list the phone numbers, addresses, or emails of individuals in the target population, such as the list of student email addresses for the Duke University student survey. In the case of this poll about marijuana attitudes, random digit dialing (RDD) was used. In random digit dialing, a computer generates a random set of seven-digit numbers. Compared to using a telephone book or other list of telephone numbers, an RDD sample frame has the advantage of including unlisted numbers.
Often, the list will not perfectly capture the entire target population. For example, telephone surveys that only call landline telephone numbers will miss individuals who only have a cell phone. This creates coverage error—the error that arises when the sampling approach does not include all of the target population. That is, when there is a failure to give some persons in the target population a chance of selection into the sample. If those included in the sample frame differ from those who are not, that coverage error can create coverage bias, affecting the accuracy of the resulting survey statistics.
Once a sample frame has been identified, individual cases are randomly selected to be in the survey. Because the survey is administered to a sample, rather than all, of the target population, it is subject to random sampling error. This is the “margin of error” mentioned in the methodological disclosure of the poll. Of course, these selected cases are just the people asked to be in the survey—many of them will be difficult to reach, will refuse to participate, or will drop out during the survey. Nonresponse error occurs when the individuals invited to take the survey are not interviewed. And the respondents are the subsample of the selected cases who actually complete the survey and on which the analysis is conducted.5 Critically, if those who respond are different from those who do not (either because of coverage error or nonresponse error) the resulting survey statistics can be biased.6
Figure 1.2 illustrates the key steps in the survey sampling process using the poll about marijuana attitudes as an example. As shown in the figure, each step in the survey sampling process can introduce uncertainty and bias in the resulting survey statistics. These errors can threaten the ability to generalize from the sample to the target population.
Figure 1.2Steps in Survey Process
Traditionally, survey users have focused on sampling error as the metric for evaluating survey quality. As mentioned, sampling error represents the uncertainty or imprecision in estimates based on random chance that occurs simply because we observe data from a sample of individuals in the population rather than every individual in the population. Sampling error is often reported as margin of error. In the case of this poll, we should interpret the results as showing that public support for marijuana legalization is 61 percent +/– 3 percentage points. This tells us how precise we are in our estimate of public opinion on this issue—the larger the margin of error, the less confidence we have in our estimate. The literal interpretation of the margin of error is somewhat long-winded and awkward: if the survey were repeated many times, 95 percent of the samples of this size would be expected to produce a margin of error that captures the true percentage of Americans supporting the legalization of marijuana.7
Critically, the size of sampling error depends only on the size of the sample collected—the larger the sample, the less uncertainty in the estimate. Sampling error does not tell us about whether our estimates are biased or inaccurate. Instead, it is only a measure of reliability. Thus, despite the traditional focus on sampling error in the reporting of survey statistics, it is actually the least important aspect of survey error; for a survey of a given size, sampling error simply “is what it is,” whereas other sources of error—coverage error, nonresponse error, measurement error—can be minimized through various design decisions.8
The total survey error perspective highlights the need to take into account not only sampling error but also the nonsampling errors, like coverage error and nonresponse error. The total survey error perspective recognizes that the substantive conclusions drawn from surveys also depend on the measurement process, in which scholars have to make decisions about how to operationalize and measure their theoretical constructs and then have to make decisions about how to code and adjust the resulting data. Nonsampling errors are different from sampling error in that it can affect not only the reliability of the results, but also the accuracy. These errors can introduce bias in the survey results if they are systematic rather than random. In the remainder of this chapter, I will use the total survey perspective to outline some of the key contemporary threats to survey quality.
Probability vs. Nonprobability Sampling
Surveys ar...
Table of contents
Cover
Endorsement
Half Title
Series Information
Title Page
Copyright Page
Contents
List of Illustrations
Contributors
Acknowledgments
Introduction and Overview
Part I The Meaning and Measurement of Public Opinion
Part II Foundations of Political Preferences
Part III The Public and Society
Index
Frequently asked questions
Yes, you can cancel anytime from the Subscription tab in your account settings on the Perlego website. Your subscription will stay active until the end of your current billing period. Learn how to cancel your subscription
No, books cannot be downloaded as external files, such as PDFs, for use outside of Perlego. However, you can download books within the Perlego app for offline reading on mobile or tablet. Learn how to download books offline
Perlego offers two plans: Essential and Complete
Essential is ideal for learners and professionals who enjoy exploring a wide range of subjects. Access the Essential Library with 800,000+ trusted titles and best-sellers across business, personal growth, and the humanities. Includes unlimited reading time and Standard Read Aloud voice.
Complete: Perfect for advanced learners and researchers needing full, unrestricted access. Unlock 1.5M+ books across hundreds of subjects, including academic and specialized titles. The Complete Plan also includes advanced features like Premium Read Aloud and Research Assistant.
Both plans are available with monthly, semester, or annual billing cycles.
We are an online textbook subscription service, where you can get access to an entire online library for less than the price of a single book per month. With over 1.5 million books across 990+ topics, we’ve got you covered! Learn about our mission
Look out for the read-aloud symbol on your next book to see if you can listen to it. The read-aloud tool reads text aloud for you, highlighting the text as it is being read. You can pause it, speed it up and slow it down. Learn more about Read Aloud
Yes! You can use the Perlego app on both iOS and Android devices to read anytime, anywhere — even offline. Perfect for commutes or when you’re on the go. Please note we cannot support devices running on iOS 13 and Android 7 or earlier. Learn more about using the app
Yes, you can access New Directions in Public Opinion by Adam J. Berinsky in PDF and/or ePUB format, as well as other popular books in Politique et relations internationales & Politique. We have over 1.5 million books available in our catalogue for you to explore.