This book presents a review of the spatial impacts of contemporary climate change, with a focus on a systematic, multi-scalar approach. Beyond the facts – rises in temperature, changes in the spatial distribution of precipitation, melting of the marine and terrestrial cryosphere, changes in hydrological regimes at high and medium latitudes, etc. – it also analyzes the geopolitical consequences in the Arctic and Central Asia, changes to Mediterranean culture and to viticulture on a global scale, as well as impacts on the distribution of life, for example, in the Amazon rainforest, in large biomes on a global scale, and for birds.
- English
- ePUB (mobile friendly)
- Available on iOS & Android
eBook - ePub
Spatial Impacts of Climate Change
About this book
Climate change has been a central concern over recent years, with visible and highly publicized consequences such as melting Arctic ice and mountain glaciers, rising sea levels, and the submersion of low-lying coastal areas during mid-latitude and tropical cyclones.
Trusted by 375,005 students
Access to over 1 million titles for a fair monthly price.
Study more efficiently using our study tools.
Information
1
Climate Change at Different Temporal and Spatial Scales
Denis Mercier
Sorbonne University, Paris, France
1.1. Contemporary global climate change
Contemporary climate change refers to the period from 1850 to the present day and covers the period from the Industrial Revolution to the digital revolution. It also covers a period during which humanity experienced a population explosion, reaching 1 billion people for the first time in 1820. On January 1, 2020, the human population was estimated at 7.7 billion and is expected to reach 11 billion by 2100, according to the UN.
Through the use of fossil fuels (coal, oil, gas) and increased agricultural production to feed the world’s growing population, these elements contribute to increasing humanity’s role in the climate machine.
Since the mid-19th Century, the average global air temperature has increased by 1.1 °C. This increase has not been linear over time and Figure 1.1 illustrates the stages of this evolution. Two warming sequences help to understand this increase: the first from 1910 to 1940 and the second from 1980 to the present day, during which the increase in temperature was 0.18°C per decade. According to the World Spatial Impacts of Climate Change, coordinated by Denis Mercier. © ISTE Ltd 2021.
Meteorological Organization1, the year 2019 was the second warmest year recorded since 1850. It comes after the year 2016, which experienced a particularly intense El Niño episode, with abnormally high ocean surface water temperatures in the eastern South Pacific. These two periods of warming are interspersed by temporal sequences of cooling (from 1880 to 1910, then from 1940 to 1980).
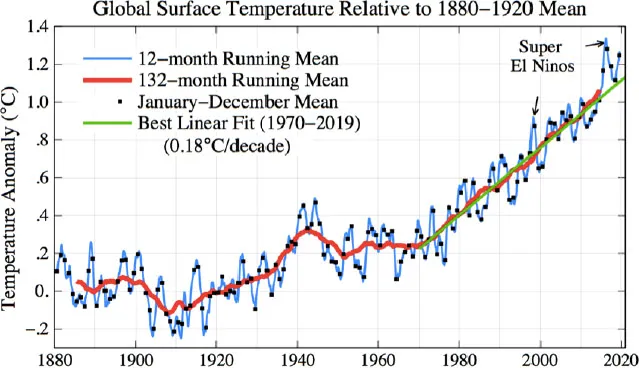
Figure 1.1. Annual mean surface temperature from 1880 to 2019 compared to the 1880-1920 mean
(source: Sato and Hansen, Climate Science, Awareness and Solutions at Columbia University Earth Institute, 2020). For a color version of this figure, see www.iste.co.uk/mercier/climate.zip
This non-linear temperature evolution over time is not spatially homogeneous (see Figure 1.2). These maps illustrate general trends. Continental land areas record this contemporary global warming better than ocean surfaces; of these continental land surfaces, those with a hypercontinental climate such as Siberia are experiencing the greatest temperature increases.
Although the map projection is not very favorable, Figure 1.2 shows that high latitude regions, especially the Arctic basin and its surroundings, have experienced the greatest increases in temperature.
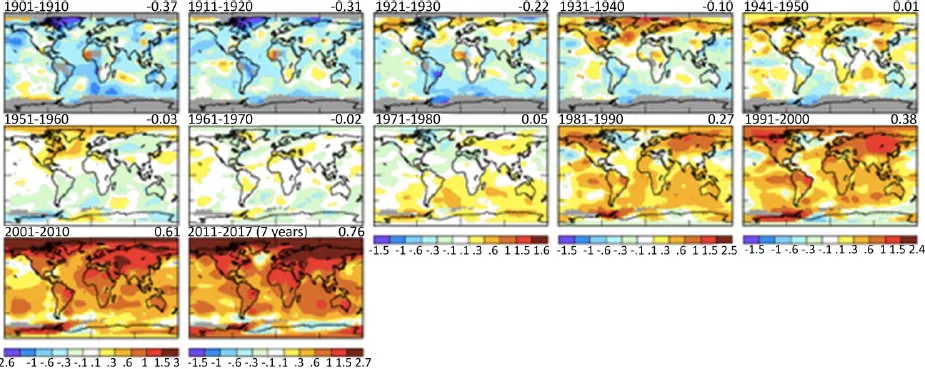
Figure 1.2. Average surface temperature per decade from 1910 to 2017 compared to the 1951-1980 average. For a color version of this figure, see www.iste.co.uk/mercier/climate.zip
(source: 2018 NASA-GISS temperature data, downloaded from https://data.giss.nasa.gov/gistemp/)
Although the oceans are warming less than land areas, they are still warming and store 93% of the excess heat. The last 10 years are the warmest recorded for ocean surface waters since 1955 with a linearly increasing temperature trend since the 1980s (see Figure 1.3) (Cheng et al. 2020). For the first period, the warming was relatively constant of approximately 2.1 ± 0.5 Zetta Joules2 per year. However, the warming in the more recent period is greater than that of the previous warming (9.4 ± 0.2 Zetta Joules per year, or 0.58 watt per m2 on average on the Earth's surface), hence the significant increase in the rate of global climate change at the ocean scale (Cheng et al. 2020).
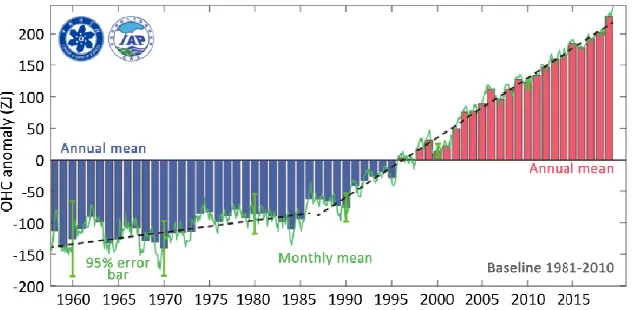
Figure 1.3. Ocean heat content (OHC) in the upper water section above 2,000 m from 1955 to 2019. For a color version of this figure, see www.iste.co.uk/mercier/climate.zip
COMMENT ON FIGURE 1.3.- The histogram represents annual anomalies (ZJ: Zetta Joules, where 1 ZJ = 1021 Joules) where positive anomalies relative to a mean calculated between 1981 and 2010 are shown as red bars and negative anomalies are shown in blue. The two dashed black lines represent linear trends for the periods 1955-1986 and 1987-2019 (source: Cheng et al. 2020).
The increase in ocean surface temperatures affects all oceans. Although some ocean areas, such as the North Atlantic, experienced a decrease in temperature between 1960 and 2019 (Cheng et al. 2020), the penetration of heat into the deep ocean is clear in Figure 1.4, mainly in the Atlantic and Southern oceans (Cheng et al. 2020). These two ocean basins, especially near the Antarctic Circumpolar Current (40° 60° S) show greater warming than most other basins (Cheng et al. 2020).
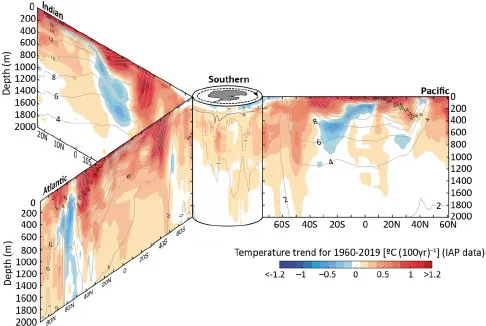
Figure 1.4. Vertical cross-section of ocean temperature trends from 1960 to 2019 from the sea surface to 2,000 m (60-year ordinary least squares linear trend). For a color version of this figure, see www.iste.co.uk/mercier/climate.zip
COMMENT ON FIGURE 1.4.- The zonal mid-sections of each ocean basin are organized around the Southern Ocean (south of 60° S) in the center. The black outlines show the associated mean temperature with 2°C intervals (in the Southern Ocean, 1°C intervals are shown as dashed lines) (source: Cheng et al. 2020)....
Table of contents
- Cover
- Table of Contents
- Title Page
- Copyright
- Introduction
- 1 Climate Change at Different Temporal and Spatial Scales
- 2 Climate Change and the Melting Cryosphere
- 3 Between Warming and Globalization: Rethinking the Arctic at the Heart of a Stakes System
- 4 Coastlines with Increased Vulnerability to Sea-level Rise
- 5 The Consequences of Climate Change on the Paraglacial Sedimentary Cascade
- 6 Spatial Impacts of Climate Change on Periglacial Environments
- 7 The Impacts of Climate Change on the Hydrological Dynamics of High Latitude Periglacial Environments
- 8 The Impacts of Climate Change on Watercourses in Temperate Environments
- 9 Spatial Impacts of Melting Central Asian Glaciers: towards a “Water War”?
- 10 Spatial Impact of Climate Change on Winter Droughts in the Mediterranean and Consequences on Agriculture
- 11 The Spatial Impacts of Climate Change on Viticulture Around the World
- 12 Climate Change in the Amazon: A Multi-scalar Approach
- 13 The Impacts of Climate Change on the Distribution of Biomes
- 14 Spatial Impacts of Climate Change on Birds
- List of Authors
- Index
- End User License Agreement
Frequently asked questions
Yes, you can cancel anytime from the Subscription tab in your account settings on the Perlego website. Your subscription will stay active until the end of your current billing period. Learn how to cancel your subscription
No, books cannot be downloaded as external files, such as PDFs, for use outside of Perlego. However, you can download books within the Perlego app for offline reading on mobile or tablet. Learn how to download books offline
Perlego offers two plans: Essential and Complete
- Essential is ideal for learners and professionals who enjoy exploring a wide range of subjects. Access the Essential Library with 800,000+ trusted titles and best-sellers across business, personal growth, and the humanities. Includes unlimited reading time and Standard Read Aloud voice.
- Complete: Perfect for advanced learners and researchers needing full, unrestricted access. Unlock 1.4M+ books across hundreds of subjects, including academic and specialized titles. The Complete Plan also includes advanced features like Premium Read Aloud and Research Assistant.
We are an online textbook subscription service, where you can get access to an entire online library for less than the price of a single book per month. With over 1 million books across 990+ topics, we’ve got you covered! Learn about our mission
Look out for the read-aloud symbol on your next book to see if you can listen to it. The read-aloud tool reads text aloud for you, highlighting the text as it is being read. You can pause it, speed it up and slow it down. Learn more about Read Aloud
Yes! You can use the Perlego app on both iOS and Android devices to read anytime, anywhere — even offline. Perfect for commutes or when you’re on the go.
Please note we cannot support devices running on iOS 13 and Android 7 or earlier. Learn more about using the app
Please note we cannot support devices running on iOS 13 and Android 7 or earlier. Learn more about using the app
Yes, you can access Spatial Impacts of Climate Change by Denis Mercier in PDF and/or ePUB format, as well as other popular books in Physical Sciences & Environmental Science. We have over one million books available in our catalogue for you to explore.