![]()
PART 1
STRUCTURAL UNDERPINNINGS OF INEQUALITY
![]()
Chapter 1
Economy
Inequality in New York City
The Intersection of Race and Class
JAMES A. PARROTT
Introduction
In a December 2013 speech, President Obama stressed that government programs such as Social Security, the minimum wage, Medicare, and Medicaid, have enabled the United States to build the “largest middle class the world has ever known.” Despite this achievement, former President Barack Obama highlighted what he believes is “the defining challenge of our time,” namely, income inequality that has been on the rise since the late 1970s. Not everyone has benefited equally from these and other programs. He observed that racial discrimination has “locked millions out of opportunity,” and that women “were too often confined to a handful of poorly paid professions.” President Obama went on to note that “it was only through painstaking struggle that more women and minorities … began to win the right to more fairly and fully participate in the economy” (Obama, 2013).
Ironically, victories in these equality struggles occurred in the late 1970s and early 1980s, just as the political and economic forces fueling polarization were gathering steam. New York City is a case in point. The postwar era of broadly shared prosperity in New York City and elsewhere ended in the 1980s when economic gains began concentrating at the top. Initially, income polarization did not preclude rising real incomes for those in the middle.
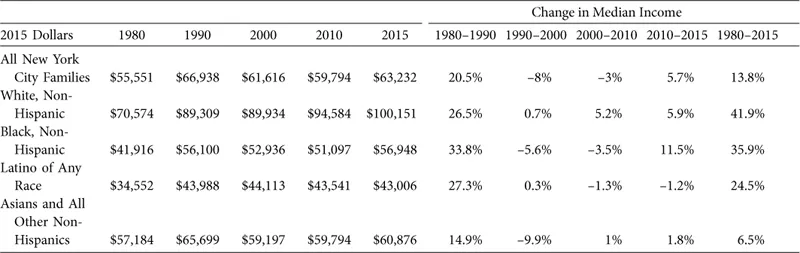
However, things changed quickly. The favorable economic picture in 1980s New York soon gave way to corporate downsizing in the 1990s, and a rapid increase in low-wage jobs, beginning in the year 2000. As a result, median family incomes for Blacks, Latinos, and Asians have generally stagnated since 1990. In the 35-year period between 1980 and 2015, real median family incomes for all New Yorkers grew by only 14 percent. The improvement among families of color, however, was much lower than for White families, and much less than the 87 percent growth in real per capita income. Median real earnings for full-time workers rose by only 7 percent. New York City’s income growth, concentrated in the hands of the few, meant that living standards for most New Yorkers grew far less than the broader growth in the city’s economy would have suggested.
This turnaround in broadly-shared prosperity occurred at the same time the composition of New York’s population changed. In 1980, the city’s population was comprised of 48 percent persons of color. By 2015, this had risen to 68 percent. The percent of immigrants increased from slightly more than a quarter of the city’s workforce in 1980 to 46 percent by 2015. During this period, the share of total income held by the richest one percent more than tripled, from 12 percent to 41 percent. White families remained predominant among the top income quintile, and almost certainly among the top one percent.
This chapter assesses several factors that have contributed to New York City’s post–1980 family income and earnings trends based on race and ethnicity. These include: the outmigration of Whites in the 1980s and 1990s; the increased number and share of immigrants; economic transformations affecting the relative growth of specific sectors and occupations; the relative economic position of New York City in that changing landscape, and; the broader national dynamic fueling the continued income polarization since the late 1970s.
The Reversal of Broadly Shared Prosperity in New York City
In the first 35 years following World War II, the United States enjoyed a period of broadly shared prosperity (Facundo, Atkinson, Piketty, & Saez, 2013). For most of this 35-year period, the share of all income flowing to the richest one percent was remarkably constant, at around 10 percent. Living standards rose across the board, the middle class grew, and poverty declined. However, as President Obama noted, Blacks and other people of color, as well as women not part of married couple families, did not share fully in this semblance of shared prosperity (Katznelson, 2005).
Beginning around 1980, income growth started concentrating at the top of the income pyramid. As Atkinson, Stiglitz, Hacker, Pierson, and others have argued, the ensuing income polarization resulted more from policy choices, and the increased political influence of those with greater economic power, than it did from globalization or skills-based technological change (Atkinson, 2015; Hacker & Pierson, 2010; 2012). During this time, labor unions were allowed to weaken, and the purchasing power of minimum wages declined. Industries were being deregulated, notably finance, and the government failed to pass campaign finance laws that would prevent the ever-increasing transformation of economic power into political power. This created, as Kuttner has written, “a self-reinforcing circle of more such policies, and more inequality” (Kuttner, 2016).
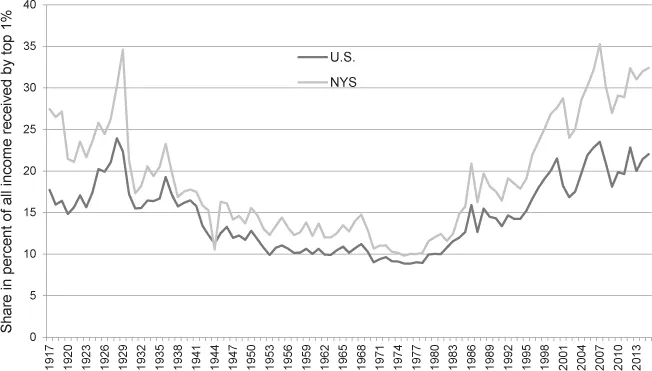
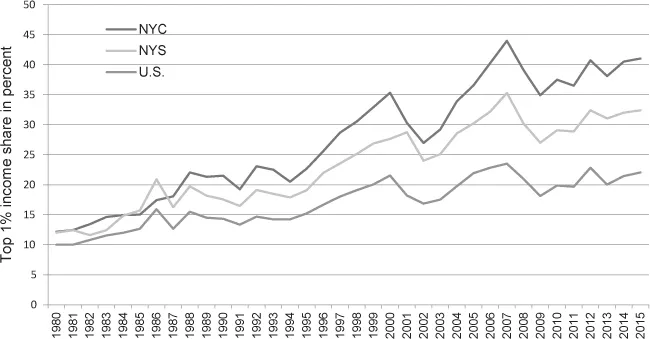
As figure 1.1 indicates, throughout the years between 1945 and 1980, the one percent’s income share in New York State tracked closely with that of the nation’s. In 1946, the one percent’s share of all New York income was 16 percent. It fell to an average of 13 percent in the 1960s, and a little above 10 percent in the 1970s. The pre-1980 income tax data needed to estimate New York City’s income shares is not available, but conceivably, the top one percent’s share in the city generally tracked a little above New York State’s. Figure 1.2 shows the one percent income share for New York City, New York State, and the United States since 1980.
Figure 1.1. 1 percent income share rises sharply after 1970s following three decades of a semblance of “shared prosperity.” Source: US data, Emmanuel Saez website, table A3, June 2016 update; New York State data, Estelle Sommeiller, Mark Price, and Ellis Wazeter, “Income inequality in the U.S. by state, metropolitan area, and county,” Economic Policy Institute, June 16, 2016.
Figure 1.2. The rising share of income going to the top 1 percent since 1980, with the fastest growth in New York City. Source: US data, Emmanuel Saez website, table A3, June 2016 update; New York State data, Estelle Sommeiller, Mark Price, and Ellis Wazeter, “Income inequality in the U.S. by state, metropolitan area, and county,” Economic Policy Institute, June 16, 2016; New York City data estimates by author based on New York State tax data from the New York City independent budget office.
It is no surprise that over the past 35 years, the one percent’s income share in New York City has risen faster than it has in the nation overall. By 2000, the one percent income share in the city was 35 percent, compared to 22 percent in the United States. By 2015, it had risen to 41 percent, only slightly higher than in 2000 for the entire United States. It should be noted that the share fluctuates in its upward trajectory based on the ups and downs in realized capital gains.
New York City is home to many people working in the highly lucrative finance sector, where compensation has soared commensurate with the growing financialization of the economy. This sector is home to many capital owners who have benefited from the increased capital share of national income. In addition, the city has relatively high concentrations of corporate managers, lawyers and other professionals who have enjoyed large compensation gains.
Gini coefficients, a common statistical measure of income inequality, are based on the Census Bureau’s definition of money income. New York City’s incomes, based on the Census Ginis, are in fact more unequal than in any of the other 25 largest U.S. cities. However, several cities are not far behind, including Washington, DC, Boston, Dallas, Los Angeles, and Houston (U.S. Bureau of the Census, 2017).
New York City’s Changing Population
New York City’s population and its composition have changed considerably over the past 35 years. During the 1970s, the city’s population declined by over 800,000, sinking to 7.1 million, its lowest level since the 1930s. The out-migration of Whites continued during the 1980s and 1990s, although a steady increase in foreign immigration, buttressed by some domestic in-migration, resulted in net population growth of nearly 21 percent, since 1980. This lifted the city’s population to over 8.5 million in 2015. Immigrants accounted for nearly all of the 1.5 million net population increase over this period. The native-born population declined by a little over one percent.
The immigrant portion of New York City’s population rose from 24 percent in 1980 to 38 percent in 2015, with the immigrant share of the resident workforce increasing from 27 to 46 percent. Immigrants, who accounted for 88 percent of the nearly 1.3 million total increase in the city’s workforce during that period, tend to be concentrated in the working age range. Persons of color comprise 80 percent of the city’s immigrant population. So, they represent large shares of the city’s non-white, race-ethnicity categories in the resident workforce. Forty-five percent of Black workers are foreign-born, as are 57 percent of Latino workers, and 82 percent of the city’s Asian workforce.
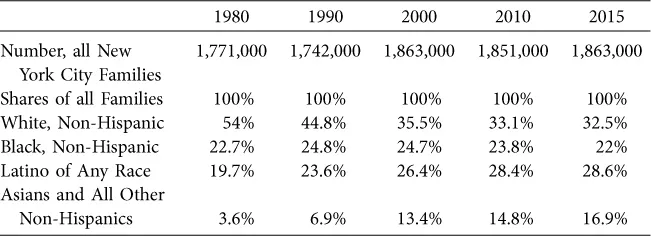
Table 1.1 shows that the share of White families in New York City fell sharply between 1980 and 2000, moving even slightly lower by 2015. The share of Black families rose somewhat between 1990 and 2000, but then returned to the 1980 level in 2015. The share of families who are Latino or Asian grew steadily between 1980 and 2015.
Table 1.1. Distribution of New York City Families by Race/Ethnicity, 1980–2015
Source: Analysis of 1980–2010 census and 2015 American Community Surveys microdata from IPUMS.
Family Incomes by Race-Ethnicity in Era of Polarization, 1980–2015
The 1980s
In the 1980s, the first decade of pronounced income concentration, median Black and Latino incomes in New York City grew, as did that of Whites. Nevertheless, income gains did accrue disproportionately to those at the high end of the income spectrum. Based on the Census Bureau’s Housing and Vacancy Survey, Weitzman noted that the top income decile claimed 42 percent of the total income gains from 1977 to 1986 (Weitzman, 1989). See Figures 1.4 and 1.5 on pages 13 and 14. In fact, during the 1980s, median Black family income grew by one-third, in inflation-adjusted terms, and median Latino family income rose by 27 percent. This was slightly faster than the growth in median White family income (Tobier, 1984).
In the 1980s, the sector including corporate and other production services, expanded (U.S. Bureau of the Census, 1983–2013, 2017). As the economy recovered from the fiscal crisis of the mid-1970s and the loss of 600,000 jobs during that time, well-educated Blacks and Latinos moved into a growing number of new professional and managerial jobs that had opened up.
Black and Latino workers also benefited from the 1980s rebound in city government employment, following the downsizing that had occurred in the immediate wake of the 1975 fiscal crisis. Of the nearly 80,000-strong increase in government jobs in the 1980s, Blacks and Latinos filled well over half of the jobs. The median pay for government jobs in New York City was 25 percent higher than the overall median in 1980, rising to one-third higher in 2015.
The 1990s
In the 1990s, however, the richest one percent again claimed nearly two-thirds of all income growth (figure 1.3), while the inflation-adjusted median incomes of Black, Latino, and Asian families stagnated or declined (table 1.2 on page 10). In part, growth in better-paying jobs was limited by the broader economic transformation in job structure. In the second half of the 1990s, total wage growth was concentrated in high-wage sectors such as finance (Lowenstein, 2016). Native-born Whites were not exempt from the large-scale corporate downsizing. In the first half of the 1990s, middle-management positions in New York City were reduced dramatically, with over 100,000 administrative support positions disappearing.
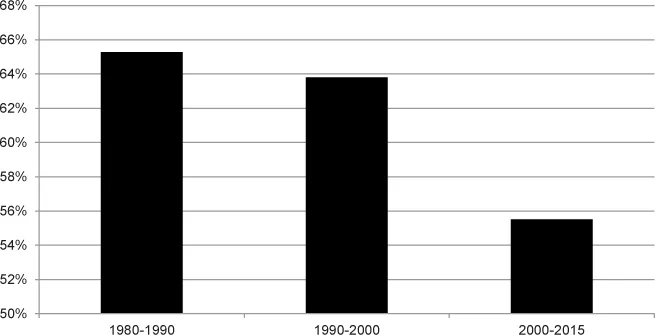
Figure 1.3. Since 1980, 55–65 percent of all income gains have gone to New York City’s richest 1 percent. Source: Author’s estimates based on New York City data in figure 2 and New York State tax data.
Table 1.2. New York City Median Family Incomes by Race/Ethnicity, 1980–2015
Source: Analysis of 1980–2010 census and 2015 American Community Surveys microdata from IPUMS.
The number of native-born Whites holding executive and managerial positions fell by a net of 35,000 in the 1990s, and by over 90,000 in administrative support occupati...