This publication provides an analysis of key challenges and opportunities for the Greater Mekong Subregion (GMS) to realize its development goals by 2030 and beyond. While the six member countries have made impressive gains in recent decades, much remains to be done to close the gap with the world's most advanced economies. The GMS needs to further integrate into the global economy, significantly upgrade production and exports, enable cities to be engines of growth, and improve the quality of road infrastructure and connectivity.
Trusted by 375,005 students
Access to over 1.5 million titles for a fair monthly price.
1.1 A STOCKTAKING OF THE EXTENT OF INTEGRATION OF THE GREATER MEKONG SUBREGION INTO THE GLOBAL ECONOMY
Aerial view of Danang Port. The port is the third largest port system in Viet Nam and lies at the eastern end of the GMS East–West Economic Corridor (EWEC), which connects Viet Nam with the Lao People's Democratic Republic, Thailand, and Myanmar (photo by Ariel Javellana/ADB).
Chapter 1
Integration of the Greater Mekong Subregion into the Global Economy
1.1 Introduction
This chapter addresses three questions: (i) To what extent are the Greater Mekong Subregion (GMS) members engaged in international trade? (ii) Are GMS economies able to penetrate rich-world markets in Europe and North America? (iii) How important is intra-GMS trade and trade within the broader Asian region for GMS members? These questions are relevant as the study considers the appropriate strategies for the GMS economies to integrate into the global economy.
The trade literature considers the idea that trade integration—in particular free trade agreements—is likely to be more welfare improving if countries are natural trading partners, meaning that they display, for example, a high initial volume of trade, geographic proximity, and trade complementarity, i.e., whether the export capacity of an exporting country can fulfill the import demand of the importing country (Wonnacott and Lutz 1989). This suggests a number of important factors to consider when thinking about trade prospects of the GMS economies. The discussion in this chapter and subsequent chapters highlights the need to integrate locally (i.e., within the region), to develop existing trade relationships, and to upgrade and diversify in order to meet the needs of rich-world markets that dominate trade flows through their role as consumers within global value chains. The analysis in this chapter will provide initial insights into some of these issues and will be used as the foundation for subsequent analysis in other chapters on the trade potential of GMS members.
1.2 The Greater Mekong Subregion Trade
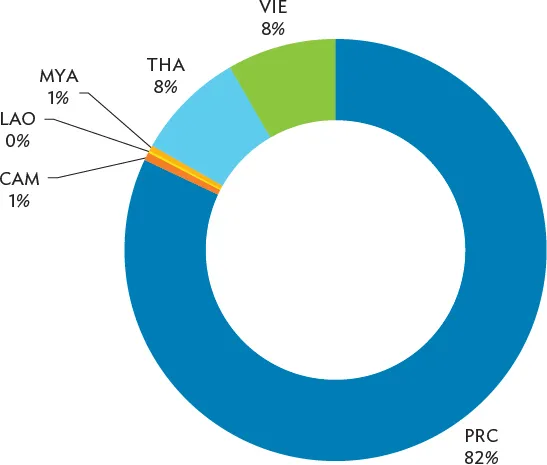
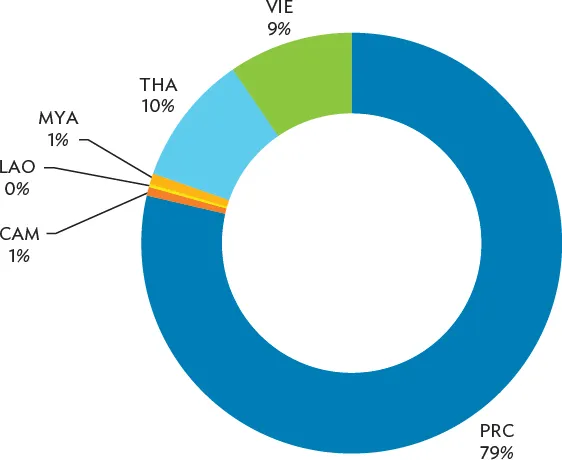
The total value of exports for the period 2016–2018 of the six GMS members (including the entire PRC, given the lack of disaggregated data for Guangxi Zhuang Autonomous Region (Guangxi) and Yunnan Province (Yunnan) was $8.9 trillion (summed over the period).9 The value of imports for the GMS members in the same period was $6.4 trillion.10 These numbers account for 18% and 13% of world exports and imports, respectively.11 It is unsurprising that the PRC accounts for the vast majority of this trade by the GMS members. This can be seen in Figures 1.1 and 1.2, which report shares of individual GMS members in total exports and imports for 2016–2018 (summed over the period), respectively. The figures reveal the dominance of the PRC within the region, accounting for 82% of total exports and 79% of total imports of the entire GMS. Much of the remaining trade is accounted for by Thailand (8% of exports and 10% of imports) and Viet Nam (8% of exports and 9% of imports), implying that Cambodia, the Lao PDR, and Myanmar combined account for just over 2% of both GMS exports and imports.
Figure 1.1: Share of Greater Mekong Subregion Exports, 2016–2018
In terms of integration into world markets, these numbers imply that, while the PRC accounts for 14.7% and 10.2% of world exports and imports, respectively, the other five countries combined account for less than 4% of world exports and imports. In Thailand, these shares are 1.5% and 1.3% for exports and imports, respectively, while for Viet Nam the shares are around 1.5% and 1.2%, respectively. In the other three countries, the shares of exports or imports account for less than one tenth of 1%.
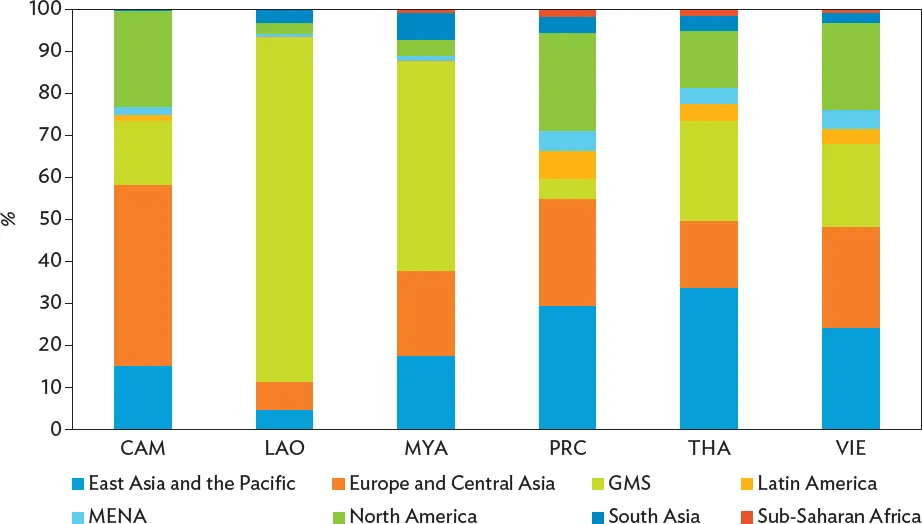
Figure 1.3 shows the share of exports of each GMS member to different regions of the world, including the GMS (exports are summed over the period 2016–2018). The figure reveals a great deal of heterogeneity in export structure by region across the GMS economies. Nearly a third (29%) of the PRC’s exports go to East Asia and the Pacific, while almost half (49%) go to either Europe and Central Asia or North America. The remaining regions account for a small share of the PRC’s exports, with other GMS members accounting for just 4.8% and South Asia just 3.8%.12 Similar to the PRC, East Asia and the Pacific also accounts for a significant share of Thailand’s (34%) and Viet Nam’s (24%) exports. Likewise, a significant share of these two countries’ exports are sent to Europe and Central Asia and North America, which account for a combined share of 29% of Thailand’s exports and 45% of Viet Nam’s. The GMS members are a more important market for these two countries’ exports than for the PRC, with shares of 24% and 20% for Thailand and Viet Nam, respectively. The Lao PDR and Myanmar are remarkable in that they rely heavily on other GMS members for their exports. The share of exports going to other GMS members is 50% for Myanmar and 82% for the Lao PDR. Europe and Central Asia (20%) and East Asia and the Pacific (18%) account for much of Myanmar’s remaining export share. Cambodia’s export structure is perhaps the most surprising, with 66% of its exports going to either Europe and Central Asia or North America. East Asia and the Pacific (15%) and other GMS members (15%) account for practically all of Cambodia’s remaining export share.
Figure 1.3: Exports by Region of Destination, 2016–2018
CAM = Cambodia, GMS = Greater Mekong Subregion, LAO = Lao People’s Democratic Republic, MENA = Middle East and North Africa, MYA = Myanmar, PRC = People’s Republic of China, THA = Thailand, VIE = Viet Nam.
Source: United Nations Comtrade.
Figure 1.4 shows that the pattern of imports is quite different from that of exports, with a larger role for GMS members in most cases. Imports of the Lao PDR and Myanmar are again dominated by trade with other GMS members. In the Lao PDR, 88% of its imports come from other GMS economies. In Myanmar, the share from other GMS members is 48%, with a significant share also coming from East Asia and the Pacific (35%). Cambodia resembles more closely the patterns observed in the Lao PDR and Myanmar, with imports predominantly sourced from other GMS members (65%) and East Asia and the Pacific (21%). Thailand and Viet Nam have large import shares from East Asia and the Pacific (36% and 39%, respectively) and other GMS economies (26% and 34%, respectively). In these two countries, Europe and Central Asia are also relevant sources of imports (17% and 14% for Thailand and Viet Nam, respectively). While East Asia and the Pacific account for the majority of the PRC’s imports (35%), imports from Europe and Central Asia (30%) and North America (10%) are also significant. More generally, the PRC’s import structure seems more diversified than that of the other GMS members, with six of the eight regions contributing a share of 5% or more to the PR...
Table of contents
Front Cover
Title Page
Copyright Page
Contents
Tables and Figures
Foreword
Acknowledgments
Contributors
Abbreviations
Executive Summary
Introduction
Part 1: Integration into the Global Economy and Upgrading
Part 2: The Role of Cities as Engines of Growth
Part 3: The Need to Improve the Quality of Road Infrastructure and Connectivity to Enhance Trade Integration and Connect Competitive Cities
Part 4: Recommendations
References
Footnotes
Back Cover
Frequently asked questions
Yes, you can cancel anytime from the Subscription tab in your account settings on the Perlego website. Your subscription will stay active until the end of your current billing period. Learn how to cancel your subscription
No, books cannot be downloaded as external files, such as PDFs, for use outside of Perlego. However, you can download books within the Perlego app for offline reading on mobile or tablet. Learn how to download books offline
Perlego offers two plans: Essential and Complete
Essential is ideal for learners and professionals who enjoy exploring a wide range of subjects. Access the Essential Library with 800,000+ trusted titles and best-sellers across business, personal growth, and the humanities. Includes unlimited reading time and Standard Read Aloud voice.
Complete: Perfect for advanced learners and researchers needing full, unrestricted access. Unlock 1.5M+ books across hundreds of subjects, including academic and specialized titles. The Complete Plan also includes advanced features like Premium Read Aloud and Research Assistant.
Both plans are available with monthly, semester, or annual billing cycles.
We are an online textbook subscription service, where you can get access to an entire online library for less than the price of a single book per month. With over 1.5 million books across 990+ topics, we’ve got you covered! Learn about our mission
Look out for the read-aloud symbol on your next book to see if you can listen to it. The read-aloud tool reads text aloud for you, highlighting the text as it is being read. You can pause it, speed it up and slow it down. Learn more about Read Aloud
Yes! You can use the Perlego app on both iOS and Android devices to read anytime, anywhere — even offline. Perfect for commutes or when you’re on the go. Please note we cannot support devices running on iOS 13 and Android 7 or earlier. Learn more about using the app
Yes, you can access The Greater Mekong Subregion 2030 and Beyond by in PDF and/or ePUB format, as well as other popular books in Politics & International Relations & Economic Conditions. We have over 1.5 million books available in our catalogue for you to explore.