A quick guide to appropriately selecting and interpreting laboratory tests, Small Animal Clinical Diagnosis by Laboratory Methods, 5th Edition helps you utilize your in-house lab or your specialty reference lab to efficiently make accurate diagnoses without running a plethora of unnecessary and low-yield tests. It provides answers to commonly asked questions relating to laboratory tests, and solutions to frequently encountered problems in small animal diagnosis. For easy reference, information is provided by clinical presentation and abnormalities, and includes hundreds of tables, boxes, key points, and algorithms. This edition, now in full color, is updated with the latest advances in laboratory testing methods and diagnostic problem solving. Written by noted educators Dr. Michael Willard and Dr. Harold Tvedten, this book may be used as an on-the-spot guide to specific problems or conditions as well as a reference for more detailed research on difficult cases.- Concise discussions address laboratory approaches to various disorders, possible conclusions from various test results, artifacts and errors in diagnoses, and interpretations leading to various diagnoses.- Hundreds of tables, boxes, algorithms, and key points offer at-a-glance information including cautions, common pitfalls, and helpful "pearls, " and lead to proper differential and clinical diagnostic decision making.- Note boxes identify key considerations in correlating clinical signs with test data for accurate diagnoses, highlight safety precautions, and offer helpful tips for sample preparation and interpretation.- Chapters on laboratory diagnostic toxicology and therapeutic drug monitoring help in handling potentially fatal poisonings and other special situations.- Expert editors and contributors provide clinical knowledge and successful diagnostic problem-solving solutions.- A practical appendix lists referral laboratories that may be contacted for certain diseases, and reference values with the normal or expected range for coagulation, hematology, and more.- Updated coverage integrates the newest advances in testing methods and diagnostic problem solving.- Full-color photos and schematic drawings are placed adjacent to related text, and accurately depict diagnostic features on microscopic slide preparations as well as test procedures and techniques.
- 432 pages
- English
- ePUB (mobile friendly)
- Available on iOS & Android
eBook - ePub
Small Animal Clinical Diagnosis by Laboratory Methods
About this book
Trusted by 375,005 students
Access to over 1.5 million titles for a fair monthly price.
Study more efficiently using our study tools.
Information
1 General Laboratory Concepts
Test Selection and Asking the Right Question
Veterinarians have many choices regarding laboratory testing. Important factors include availability of reference laboratory testing, reliability and ease of in-clinic testing, cost-effectiveness, accuracy, and turnaround time. One must determine what tests to perform in-clinic and what tests to send out to a veterinary reference laboratory or to a local human laboratory. Recent improvements in the automation and ease of use of analyzers designed for in-clinic use are changing what is acceptable. Correct choices vary with the needs and patient population of each veterinary clinic. No one answer fits all situations.
To get a specific and meaningful answer from laboratory testing, the diagnostician must ask a specific and meaningful question and understand whether a particular laboratory test is likely to yield a useful answer. As an example, compare the likely outcome of asking the following questions: “Is the animal anemic?” “What is wrong with the animal?” A microhematocrit procedure (in addition to knowledge of the animal’s hydration status) will usually answer the first specific question, but a serum chemistry profile, complete blood count (CBC), urinalysis, and fecal examination may or may not answer the second vague, nonspecific question. A clinician should ask, “What will a high, low, or normal test result specifically mean in terms of making a correct diagnosis, providing accurate prognostic information, or choosing an appropriate therapeutic plan?” If the answer is meaningful (i.e., it will change some action taken by the clinician), the test is worth the cost. Normal laboratory results may eliminate certain diseases (i.e., have high negative predictive value [NPV]) and can be as valuable as abnormal results.
Note
To choose the appropriate test that will provide a specific diagnostic answer, a very specific question must be asked.
Simple Statistics and Practical Interpretations
A reasonable level of skepticism about laboratory results should be maintained. Clinicians should not believe all numbers. All laboratory data should be interpreted in the context of the history, physical examination, and other diagnostic findings in a patient. Unexpected results are common and should stimulate the clinician to reevaluate the provisional diagnosis and look for additional diseases or consider possible causes for erroneous laboratory results. Trends over several days are often more informative than test results on a single day. Typically, not all test results that “should be” abnormal in a disease situation are abnormal in each affected patient.
Note
A reasonable level of skepticism about laboratory results should be maintained.
When interpreting laboratory tests, it is important to keep in mind that reference intervals include the results expected in 95% of normal animals. Thus 5% of results in normal animals (i.e., 1 of 20) are expected to be outside the reference intervals. If a profile of 20 tests is performed, only 36% of normal animals would have all 20 results within the 95% confidence interval reference values. Diagnosticians must expect some false-positive and false-negative test results. No tests are 100% sensitive and 100% specific for a disease.
Note
Only slightly more than one third of normal animals are likely to have “normal” results in all tests of a 20-test profile. The clinician should not over interpret small changes from reference intervals.
Abnormal results in normal animals are often only slightly above or below the reference interval. The magnitude of a change helps determine one’s confidence that a disease is present. Large alterations usually allow greater confidence that the animal is abnormal, because they are less likely the result of statistical chance. With many tests, increasing magnitude of deviation from normal also reflects a more severe disease and worsening prognosis.
Laboratory methods vary in their ability to provide the same result when a sample is repeatedly analyzed (i.e., analytical precision). The coefficient of variation (CV) is often used to indicate the precision of an assay. Assays with a low CV have a high degree of precision; small changes in results can be attributed to changes in the patient and not random variation in the assay itself. Assays with a high CV have poorer precision; small changes in results may be due to variation in the assay and not indicative of disease in the patient. For example, because of the great imprecision of a manual leukocyte, platelet, or erythrocyte count, results can vary 10% to 20% only because of technique; therefore mild changes from one day to the next may reflect only imprecision in the procedure rather than actual changes in the patient.
Evaluating populations of apparently healthy animals with screening tests is much different from testing individual sick animals. The predictive value of a test is strongly affected by the prevalence of disease in a population.3 For example, if a disease occurs in 1 of 1000 animals and a test is 95% specific and sensitive for the disease, what is the chance that an animal with a positive test result actually has the disease (i.e., positive predictive value [PPV])? Most students, residents, and clinicians answered this question incorrectly; the average response was 56% with a range of 0.095% to 99%. If the test is 95% sensitive, 95% of all animals with the disease should be detected. Therefore the one animal in 1000 that has the disease should be positive. If the test has a specificity of 95%, then 5% of the 999 animals in 1000 that do not have the disease, or about 50, will have a false-positive test result. The PPV (i.e., the number of true-positive tests/total number of positive test results) of this test is only about 2%, because only 1 of those 51 animals with a positive test result will have the disease. There are mainly false-positive results to interpret and explain to the animal owners.
Screening tests with a high sensitivity are often useful to rule out a disease. In the example above with a test that has a sensitivity of 95%, 5% of animals with the disease will not be detected and will be false negatives. Using the above situation, if 1 in 1000 animals has the disease, then 0.05 animals will have a false-negative result. If the specificity is 95%, then 949 of 999 animals in 1000 that do not have the disease are true negatives. Thus the NPV (number of true-negative tests/total number of negative test results; 949/949.05) is greater than 99.9%.
Note
Evaluating test results from populations of apparently healthy animals is much different from evaluating results in individual sick animals.
If a test is performed only when the disease is likely instead of screening all animals (including those with no clinical signs) for a disease, then the frequency of diseased animals in the test population is higher. Testing for disease in sick patients is exemplified by heartworm testing. Consider an example in which a test for heartworm disease is 99% sensitive and 90% specific and is used in 100 outside dogs in a heartworm-endemic area.5 If the incidence of disease is 50%, then one should identify 49.5 of the 50 ill dogs and obtain 5 false-positive results in the 50 dogs without heartworms. Thus the PPV in this situation is 49.5/54.5 or 91%. There are still false positives to interpret, but greatly fewer.
Receiver operating characteristic (ROC) curves (Figure 1-1) are used to determine the effectiveness of a test in diagnosis. ROC curves plot the true-positive rate (as indicated by the diagnostic sensitivity of an assay) against the false-positive rate (1 − the diagnostic specificity of an assay) calculated at various concentrations over the range of the test’s results. A good test has a great increase in the true-positive rate along the y axis for a minimal increase in the false-positive rate along the x axis. The 45-degree line in Figure 1-1 would indicate an ineffective test, which would have an equal increase in false positives and in true positives. Whether a positive result on such a test was a true positive or a false positive would be random chance, like tossing a coin. Figure 1-1 illustrates that serum creatinine and urea (measured as blood urea nitrogen [BUN]) are very good tests of renal failure in dogs and very similar in effectiveness.2 The urea/creatinine ratio is noticeably worse than either creatinine or urea, as illustrated by being closer to the 45-degree angle line (and having less area under the curve).
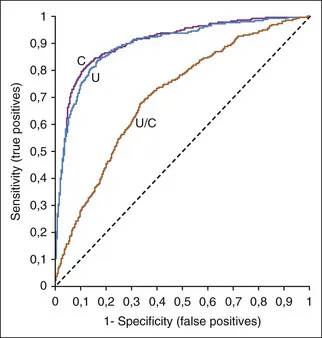
FIGURE 1-1 A ROC curve is a way to show the effectiveness of a test. Increased serum urea concentration, creatinine concentration, and urea/creatinine ratios were compared in diagnosis of 417 dogs with renal failure, 1463 normal dogs, and 2418 sick dogs without renal disease.2 The area under the ROC curves show that serum creatinine and urea concentrations were very similar in diagnostic accuracy but the urea/creatinine ratio was obviously worse than either of them.
ROC curves are also useful in selecting upper and lower decision thresholds that can be used to decide when a diagnosis can be ruled in or ruled out. Note that decision (or diagnostic) thresholds are different than reference intervals. Animals with a test result below the lower decision threshold limit are unlikely to have the disease being tested for; animals with a test result above the higher decision threshold limit are likely to have the disease.
Diagnostic thresholds for renal failure are suggested where the creatinine or urea ROC curves in Figure 1-1 rapidly change their upward angle and begin to turn and plateau to the right. Lower to the left along the curve is a higher concentration threshold with greater specificity and lower sensitivity. More to the upper right is a lower threshold with greater sensitivity and lower specificity. At the bend in the curve, the test has optimal sensitivity (increase in true positives) with minimal loss of specificity (increase in false positives).
Reference Values
Reference values (i.e., reference ranges, reference intervals, “normal” ranges) are used to determine if a test result...
Table of contents
- Cover
- Title Page
- Copyright
- Contributors
- Preface
- Dedication
- Table of Contents
- Chapter 1: General Laboratory Concepts
- Chapter 2: The Complete Blood Count, Bone Marrow Examination, and Blood Banking: General Comments and Selected Techniques
- Chapter 3: Erythrocyte Disorders
- Chapter 4: Leukocyte Disorders
- Chapter 5: Hemostatic Abnormalities
- Chapter 6: Electrolyte and Acid-Base Disorders
- Chapter 7: Urinary Disorders
- Chapter 8: Endocrine, Metabolic, and Lipid Disorders
- Chapter 9: Gastrointestinal, Pancreatic, and Hepatic Disorders
- Chapter 10: Fluid Accumulation Disorders
- Chapter 11: Respiratory and Cardiac Disorders
- Chapter 12: Immunologic and Plasma Protein Disorders
- Chapter 13: Reproductive Disorders
- Chapter 14: Neurologic Disorders
- Chapter 15: Microbiology and Infectious Disease
- Chapter 16: Cytology of Inflammatory or Neoplastic Masses
- Chapter 17: Laboratory Diagnostic Toxicology
- Chapter 18: Therapeutic Drug Monitoring
- Appendix I: Listing of Selected Referral and Commerical Laboratories
- Appendix II: Listing of Selected Reference Values
- Index
Frequently asked questions
Yes, you can cancel anytime from the Subscription tab in your account settings on the Perlego website. Your subscription will stay active until the end of your current billing period. Learn how to cancel your subscription
No, books cannot be downloaded as external files, such as PDFs, for use outside of Perlego. However, you can download books within the Perlego app for offline reading on mobile or tablet. Learn how to download books offline
Perlego offers two plans: Essential and Complete
- Essential is ideal for learners and professionals who enjoy exploring a wide range of subjects. Access the Essential Library with 800,000+ trusted titles and best-sellers across business, personal growth, and the humanities. Includes unlimited reading time and Standard Read Aloud voice.
- Complete: Perfect for advanced learners and researchers needing full, unrestricted access. Unlock 1.5M+ books across hundreds of subjects, including academic and specialized titles. The Complete Plan also includes advanced features like Premium Read Aloud and Research Assistant.
We are an online textbook subscription service, where you can get access to an entire online library for less than the price of a single book per month. With over 1.5 million books across 990+ topics, we’ve got you covered! Learn about our mission
Look out for the read-aloud symbol on your next book to see if you can listen to it. The read-aloud tool reads text aloud for you, highlighting the text as it is being read. You can pause it, speed it up and slow it down. Learn more about Read Aloud
Yes! You can use the Perlego app on both iOS and Android devices to read anytime, anywhere — even offline. Perfect for commutes or when you’re on the go.
Please note we cannot support devices running on iOS 13 and Android 7 or earlier. Learn more about using the app
Please note we cannot support devices running on iOS 13 and Android 7 or earlier. Learn more about using the app
Yes, you can access Small Animal Clinical Diagnosis by Laboratory Methods by Michael D. Willard,Harold Tvedten in PDF and/or ePUB format, as well as other popular books in Medicine & Veterinary Medicine. We have over 1.5 million books available in our catalogue for you to explore.