“Green” buildings—buildings that use fewer resources to build and to sustain—are commonly thought to be too expensive to attract builders and buyers. But are they? The answer to this question has enormous consequences, since residential and commercial buildings together account for nearly 50% of American energy consumption—including at least 75% of electricity usage—according to recent government statistics.
This eye-opening book reports the results of a large-scale study based on extensive financial and technical analyses of more than 150 green buildings in the U.S. and ten other countries. It provides detailed findings on the costs and financial benefits of building green. According to the study, green buildings cost roughly 2% more to build than conventional buildings—far less than previously assumed—and provide a wide range of financial, health and social benefits. In addition, green buildings reduce energy use by an average of 33%, resulting in significant cost savings.
Greening Our Built World also evaluates the cost effectiveness of “green community development” and presents the results of the first-ever survey of green buildings constructed by faith-based organizations. Throughout the book, leading practitioners in green design—including architects, developers, and property owners—share their own experiences in building green. A compelling combination of rock-solid facts and specific examples, this book proves that green design is both cost-effective and earth-friendly.
- 280 pages
- English
- ePUB (mobile friendly)
- Available on iOS & Android
eBook - ePub
About this book
Trusted by 375,005 students
Access to over 1.5 million titles for a fair monthly price.
Study more efficiently using our study tools.
Information
Topic
ArchitectureSubtopic
Architecture GeneralPART I
COSTS AND BENEFITS OF GREEN BUILDING
Perhaps because we spend the vast majority of our lives in buildings or traveling between them, we often overlook the scale of building energy use and the associated impact on climate change. For example, in a 2007 national survey of 1,000 homeowners, almost 75% said that they believed their homes had no adverse environmental impact.1 The reality is quite different. According to the Energy Information Agency, residential and commercial buildings together consume 41% of the energy, including 74% of the electricity, used in the United States—a figure that does not include energy use in industrial office buildings. And of course, it also takes energy to make the materials necessary to construct and operate buildings (e.g., bricks, concrete, mechanical systems); to transport the materials; and to actually construct buildings. Despite widespread misperception, at least 45% of all energy used in the United States and Europe is consumed directly in buildings. The level of energy use and the resulting CO2 emissions associated with buildings are almost as high as that from transportation and industry combined. Thus, the built environment provides a powerful and necessary lever for fundamentally changing our patterns of resource and energy use and responding to the grave reality of climate change.
1.1. Methodology
Over a 20-month period beginning in 2007, working with over 100 architects, developers, green building consultants, and building owners, we surveyed over 300 buildings and gathered detailed data on 170 green buildings, including the costs of going green; energy and water savings; and health, productivity, and other benefits.2 We then synthesized the results of our survey with findings from other studies, to develop estimates of the present value of costs and benefits. The other studies took a number of forms and addressed a range of issues; they included large-scale building-performance surveys, health research, case studies, market studies, policy research, economic modeling efforts, and detailed analyses of the costs of green and nongreen buildings. To accompany this data and analysis, we solicited the perspectives of leading practitioners in the field: architects; academics; and corporate, nonprofit, and community leaders.
We sought examples of green buildings, primarily in the United States, that were either completed or under construction, and that were certified or anticipating certification through the U.S. Green Building Council’s (USGBC’s) Leadership in Energy and Environmental Design (LEED) rating system or other similar system.3 Another criterion for inclusion was the availability of data on cost and performance that could be compared to data for a conventional version of the same building. Data were gathered directly from building owners, architects, and developers. (Appendix A describes the data-gathering methodology in detail.)
The 170 buildings for which the data sources (e.g., the architect or the developer) were able to provide information on the green premium—that is, the incremental cost of green building—make up the final data set used for cost-benefit modeling.4 (Appendix C lists the major data points for each building.) To allow comparability of financial impacts over time, costs and benefits are expressed in terms of dollars per square foot ($/sf).
We looked at a wide range of building types, including schools, owner-occupied offices, offices built on spec, health care facilities, multifamily residential buildings, theaters, places of worship, college and university facilities, and laboratories (see figure 1.1). Because the buildings achieved LEED or equivalent certifications and a range of energy and water-use savings, we were able to evaluate the cost-effectiveness of different levels of performance and benefits. The data set includes buildings in 33 states and eight countries, completed between 1998 and 2009 (see figure 1.2), with from 2,400 to 2 million square feet.5
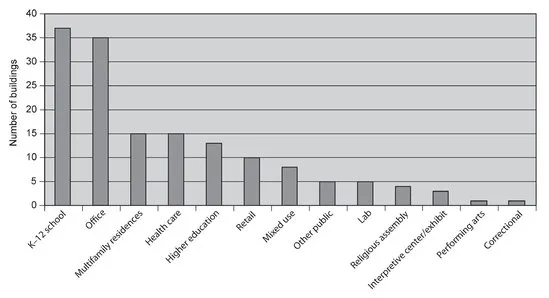
FIGURE 1.1 Building Types in the Data Set
BENEFIT MODELING
We developed net-present-value (NPV) and simple payback models to compare life-cycle benefits (including energy and water savings; emissions reductions; and increases in job creation, health, and productivity) with the initial cost of going green. Modeling requires assumptions, which are described in the relevant sections and in the appendixes. The general assumptions used in all of our present-value calculations are described in this section.
NPV calculations allow cost premiums to be compared with a subsequent stream of financial benefits. NPV represents the present value of an investment’s discounted future benefits, minus any initial investment. Modeling NPV on a $/sf basis allowed us to compare initial building costs with a future stream of benefits.
Building benefits were calculated assuming a 20-year period—which tends to underestimate benefits, because 20 years is substantially shorter than the useful life of most buildings.
Present-value calculations of future benefits were based on a 7% discount rate. This rate is equal to or higher than the rate at which states, the federal government, and many corporations have historically borrowed money, and thus provides a reasonable basis for calculating the current value of future benefits. Unless otherwise noted, we assumed 2% annual inflation.
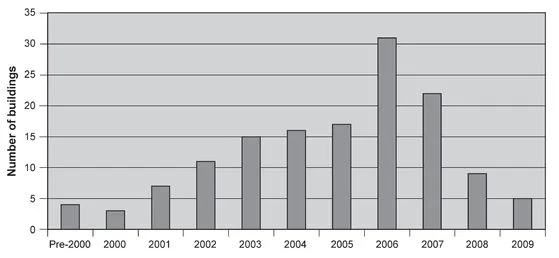
FIGURE 1.2 Buildings in the Data Set, by Year of Completion or Projected Completion
One of the primary challenges of any cost-benefit analysis is defining the baselines for the measurement of cost and performance. In the case of energy and water savings, the contacts for each building (typically the building architect or engineer) relied on industry standards to create a baseline for conventional buildings, against which green building savings could be measured. The building architect also provided the cost premiums, to allow a comparison between green building costs and the baseline. Standards and considerations that determined the selection of baselines and helped define our survey questions are addressed in detail in the other sections of the book and summarized in appendix E.
BASIS FOR BENEFIT MODELS
For over two-thirds of the buildings in our study, we were able to obtain information on energy and water savings, and for over one-third, data on construction-waste recycling and the use of recycled and local materials. Modeled benefits from energy and water savings and emissions reductions are based on building performance or attributes documented in this study, using appropriate assumptions. Estimated employment impacts are based on macroeconomic simulations run using data inputs from buildings in the data set.
To obtain credits, most LEED-certified buildings must undertake detailed modeling of energy and water savings and track the recycling of construction waste and the use of recycled and local materials. Impacts on health, productivity, and property values are relatively difficult to quantify, however, and are not required to be measured for green certification.6 Information on health and productivity effects in the data set is therefore sparse. Additionally, a majority of our data sources were architects, who generally did not have access to information about ongoing effects on occupants. Thus, we used a synthesis of relevant literature and widely referenced models to quantify health, productivity, property value, and employment effects. We drew on a range of research, including surveys of occupants in green buildings, statistical analysis of real estate data from green buildings, and macroeconomic models of green building costs and energy expenditures.
PRIVATE VERSUS PUBLIC BENEFITS
The study models benefits that accrue in two distinct ways: (1) directly to building occupants and owners, and (2) indirectly to the surrounding communities and society at large. Both categories of benefits are described and presented in the models because both are substantial. Reductions in energy and water use and changes in operations and maintenance requirements commonly have direct financial consequences for building owners and occupants, as well as indirect impacts on society (e.g., decreased need for investment in expanding public water-treatment facilities).
Occupants experience direct health and productivity benefits, and employers and society experience indirect benefits. Reductions in emissions and storm-water flow, changes in employment brought about by new technologies, and changes in energy demand, for example, have financial consequences for state and local governments. The magnitude of these benefits is often hard to calculate precisely, but is generally significant. These benefits, therefore, should be material factors in developing green building projects, initiatives, regulations, requirements, and incentives.
LIMITATIONS
The broad approach taken here has some limitations that readers should bear in mind. Soliciting voluntary study participants and requiring that sources share certain types of data create a potential for bias in the selection of firms and projects. One might, for example, expect this data set to represent a generally more successful pool of projects than green buildings in general. In terms of cost premiums, however, it is not clear that the selection process would skew the data in only one direction; while some sources might want to share a cost-effective project, others appear eager to publicize buildings that showcase a large financial commitment to green goals.
Although the data set captures much of the diversity of the green building market in terms of geography, performance, and building type, the data set is not precisely representative of the actual national population of green buildings. For example, a comparison to the USGBC’s records on certified and registered projects reveals that the buildings in the data set tend to be greener than average (e.g., greater reported reductions in energy use, a higher percentage of Platinum buildings). As a consequence, buildings in the data set would be expected to have slightly higher energy and water savings and reported green premiums than those associated with “average” green buildings built in the past decade (see appendix D). The bias toward greener buildings in this data set, which consists of buildings constructed over the past decade, coincides with the continuing trend toward greener buildings over time, suggesting that the data set provides a reasonable basis for anticipating the performance of new green buildings.
Finally, this book does not compare actual to projected performance; the primary focus is on the financial costs and benefits of green versus conventional buildings, given the best currently available information. In estimating long-term costs and benefits, we have used modeled costs and projected energy and water savings data where actual data were not available. For more information about measured performance of green buildings, see appendix I.
1.2. The Cost of Building Green
Question: How much does it cost to build a green building compared with a conventional building?
Evidence: The 170 (U.S.) buildings and 10 non-U.S. buildings in the data set reported green...
Table of contents
- About Island Press
- Title Page
- Copyright Page
- Dedication
- Table of Contents
- SPONSORING ORGANIZATIONS
- ACKNOWLEDGMENTS
- INTRODUCTION
- PART I - COSTS AND BENEFITS OF GREEN BUILDING
- PART II - COSTS AND BENEFITS OF GREEN COMMUNITY DESIGN
- PART III - COMMUNITIES OF FAITH BUILDING GREEN
- PART IV - GREEN DESIGN, CLIMATE CHANGE, AND THE ECONOMY: POTENTIAL IMPACTS IN THE UNITED STATES
- Conclusion
- APPENDIX A - DATA-COLLECTION METHODOLOGY
- APPENDIX B - SOURCE LIST
- APPENDIX C - GREEN BUILDING DATA SET
- APPENDIX D - COMPARISON OF DATA SET TO LEED–NEW CONSTRUCTION BUILDINGS
- APPENDIX E - BASELINES USED IN COST AND BENEFITS ESTIMATES
- APPENDIX F - ISSUES IN RESEARCHING THE COST OF GREEN BUILDING
- APPENDIX G - COST OF ENERGY-EFFICIENCY AND RENEWABLE-ENERGY MEASURES
- APPENDIX H ENERGY-USE BASELINES AND STANDARDS
- APPENDIX I - VERIFYING THE ENERGY PERFORMANCE OF LEED BUILDINGS
- APPENDIX J - ASSUMPTIONS USED FOR CALCULATIONS OF WATER SAVINGS
- APPENDIX K - GREEN BUILDING SURVEY INSTRUMENT
- APPENDIX L - GLOBAL ASSUMPTIONS FOR PART IV
- ABOUT THE AUTHORS
- NOTES
- INDEX
- Island Press, | Board of Directors
Frequently asked questions
Yes, you can cancel anytime from the Subscription tab in your account settings on the Perlego website. Your subscription will stay active until the end of your current billing period. Learn how to cancel your subscription
No, books cannot be downloaded as external files, such as PDFs, for use outside of Perlego. However, you can download books within the Perlego app for offline reading on mobile or tablet. Learn how to download books offline
Perlego offers two plans: Essential and Complete
- Essential is ideal for learners and professionals who enjoy exploring a wide range of subjects. Access the Essential Library with 800,000+ trusted titles and best-sellers across business, personal growth, and the humanities. Includes unlimited reading time and Standard Read Aloud voice.
- Complete: Perfect for advanced learners and researchers needing full, unrestricted access. Unlock 1.5M+ books across hundreds of subjects, including academic and specialized titles. The Complete Plan also includes advanced features like Premium Read Aloud and Research Assistant.
We are an online textbook subscription service, where you can get access to an entire online library for less than the price of a single book per month. With over 1.5 million books across 990+ topics, we’ve got you covered! Learn about our mission
Look out for the read-aloud symbol on your next book to see if you can listen to it. The read-aloud tool reads text aloud for you, highlighting the text as it is being read. You can pause it, speed it up and slow it down. Learn more about Read Aloud
Yes! You can use the Perlego app on both iOS and Android devices to read anytime, anywhere — even offline. Perfect for commutes or when you’re on the go.
Please note we cannot support devices running on iOS 13 and Android 7 or earlier. Learn more about using the app
Please note we cannot support devices running on iOS 13 and Android 7 or earlier. Learn more about using the app
Yes, you can access Greening Our Built World by Greg Kats in PDF and/or ePUB format, as well as other popular books in Architecture & Architecture General. We have over 1.5 million books available in our catalogue for you to explore.