This book is designed to help you gain confidence in analysing and interpreting quantitative data and using appropriate statistical tests, by exploring, in plain language, a variety of data analysis methods.
Highly practical, each chapter includes step-by-step instructions on how to run specific statistical tests using R, practical tips on how to interpret results correctly and exercises to put into practice what you have learned.
It also includes guidance on how to use R and RStudio, how to visualise quantitative data, and the fundamentals of inferential statistics, estimations and hypothesis testing.
Chapter 1: Introduction to information, knowledge and quantitative data 3
Chapter 2: An introduction to R and RStudio 13
1 Introduction to information, knowledge and quantitative data
Chapter Objectives
In this chapter, we will:
define quantitative data
discuss the difference between data, information and knowledge
explore and exemplify the difference between discrete and continuous data
define and exemplify scales (or levels) of measurement in education research
describe, discuss and exemplify concepts, constructs and variables
discover the relationship between concepts and research problems and hypotheses.
Educational research deals with complex information and variability in qualitative and quantitative data collected using various research methods, such as tests, observations, interventions, interviews or questionnaires. Analysing and interpreting educational data, especially quantitative data, which is often linked with statistical techniques, and learning the mathematical theory behind statistical concepts is not an easy task for most researchers, students, teachers or policy-makers. This book aims to keep the mathematical calculations to a minimum and emphasise the practical applications of the analysis of quantitative data and interpretation of various statistical test results in educational research.
Most educational research involves generating quantitative data, also called numerical data. Analysing, interpreting and presenting this type of data is becoming increasingly important as a tool in various investigations, not only in universities but also in schools. When the results of an intervention or series of observations have been recorded, the final aim is to interpret them and reach reliable conclusions. Standard procedures in an educational research design consist of collecting, organising and analysing data, followed by interpreting the results and presenting findings. Due to the variability within educational data, the results can be examined using descriptive and inferential statistics. The choice of statistics will be guided, in the first instance, by levels of measurement and distribution of data. In addition, theoretical stance and ethical factors can influence a researcher’s choice of research methods to analyse quantitative data. For example, positivists are generally concerned with reliability and representativeness, and they will consider inferential statistics, which fulfil these requirements. The choice of statistical tests will be guided throughout the research process by the methodological approach adopted, which in turn depends on how the research question and hypotheses are formulated.
1.1 Quantitative data, information and knowledge in education
Data is a rich source of information and might reveal essential aspects of knowledge in the education process. Quantitative data is used at different levels and in various settings, from teachers and researchers to local, national and international authorities, and is important in all areas of education, including the fields of policy, practice and research. For example, the various types of attitude and performance assessments create large sets of quantitative data on student performance at school, regional, national and international levels. Quantitative data is often referred to as evidence for decision-making and accountability or can provide a basis for investigating a research problem and/or generating the information used in policy-making and knowledge.
In recent years, a considerable amount of educational data has been created, and its availability is growing due to a new generation of technology. As a result, there is considerable and growing interest in and need for turning such data into useful information and knowledge from a broad range of perspectives: in theory, research and practice. However, data is just ‘raw material’, and the process of transforming data into information and knowledge has been seen as a linear and hierarchical process which can be represented by the data–information–knowledge–wisdom (DIKW) model. The presumption of this model is that data is transformed into wisdom using a stepwise process based on the six ‘W’ questions. The process starts with the collection of raw data, followed by data analysis to answer the ‘who’, ‘what’, ‘when’ and ‘where’ questions about that raw data, which at this stage becomes information. In the third step, the information is converted into knowledge by trying to answer the ‘how’ question about the information. And in the final step, the knowledge is applied and implemented to answer the ‘why’ question. Zins (2007) has documented over 100 definitions of data, information and knowledge, which reflect different theoretical and philosophical perspectives. For example, data is defined as ‘facts and statistics that can be measured, counted and stored’. Information gives ‘meaning, relevance and purpose’ to quantified data. Knowledge is information that has been emerging from analysis, reflection upon and synthesis of information (Zins, 2007, p. 483).
In this book, we do not propose a new model or follow the DIKW model, because all processes of educational data collection and analysis follow a complex and nonlinear path. The exponential development of technology has made it possible to perform an advanced data analysis which involves introducing educational data mining to explore the multiple levels of hierarchy in educational data to transform information into knowledge. Before performing any types of analysis, data has to be organised and categorised, and, using data visualisation, a researcher can quickly get information (for example, on how students choose to use their electronic devices) and consider data at various levels (such as the session level, student level, classroom level, and university level). Furthermore, the transformation of information from concepts into constructs and variables and the use of descriptive and inferential statistical techniques will enable a better understanding of educational processes and phenomena.
1.1.1 What is quantitative data?
Quantitative data is numerical information that is measured or counted and recorded in a variety of forms, including counts, scores or ranks. There are two types of quantitative data. If data is acquired directly by the researcher, then it is classified as primary quantitative data. Typical examples of methods to collect primary quantitative data include interviews and questionnaires that employ closed-ended questions. Counting the number of pupils passing an exam or observing and making notes on the time spent by a group of children solving a problem are examples of primary quantitative data. If quantitative data is collected from published papers or government publications and unpublished research, it is classified as secondary quantitative data.
If the quantitative data, whether primary or secondary, can take a finite number of possible values, then it would be classified as discrete data. Typically, this type of data involves integer numbers (for example, the number of pupils taking a maths exam). If the numerical values fall on a continuum, and it is possible to have fractional or decimal values (such as height, age, and distance), this numerical data would be classified as continuous data. For example, we can divide this type of data into smaller and smaller portions; each portion’s value continues to have a meaning.
1.2 Measurement and scales of measurement
1.2.1 What is a measurement? What is a scale?
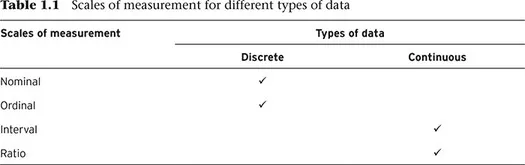
The concepts of measurement and scales of measurement are often used interchangeably by practitioners and in some news articles and textbooks. However, they do not have the same meaning. Stevens (1946, p. 677) defines measurement, in general terms, as the ‘assignment of numerals to objects or events according to rules’. There is an interlocking connection between the aspects of an object or event, the properties of numerals, and certain empirical operations performed, which will lead to certain types of scales, as shown in Table 1.1. The four scales of measurement are nominal, ordinal, interval and ratio. Also, these scales of measurement can serve as a guide to the statistical procedures that can be used with the data and the conclusions that can be drawn from them.
Table 1.1
Nominal measurement involves arranging data into named categories which are qualitatively rather than quantitatively different and do not have an implicit or natural order, rank or value. For example, pupils can be classified into gender groups (boys and girls), religious groups (Christian and non-Christian), and school groups (state, independent and grammar). The process of assigning numerical codes for categories is called quantitative coding. Numbers can be assigned as labels, but only arbitrarily, to identify the categories. For example, school groups may be given labels 1, 2 and 3. These numbers do not represent the absolute or relative amount of any characteristics; they only help to identify the members of a given group and cannot be arithmetically manipulated through mathematical calculations such as addition, subtraction, multiplication or division. The only mathematical operation permitted is counting the number of observations in each category, from which the frequency and the mode (Table 1.2) can be calculated.
Table 1.2
An ordinal measurement indicates the relative position of the individuals or objects concerning a specific attribute and a specific progression or ordering (increasing or decreasing). At this level, the intervals between adjacent groups, or the distances between the positions, are not assumed to be the same. Ordinal measurement requires that the elements of a category can be rank-ordered on an operationally defined characteristic or property. When a teacher ranks his students on individual characteristics such as their spelling ability on a scale from 1 to 5, an ordinal measurement occurs. At the ordinal level, data is ordered (for example, 5 is the best score and is better than 4, which is better than 3 and so on), but we cannot be sure that the distances between any two consecutive values are equal. In this case, the only information considered for analysis is their order.
Another example of the ordinal scale used extensively in educational research is the Likert scale. If numbers 1, 2, 3, 4, 5 are used to indicate degrees of agreement, from strongly agree to strongly disagree, with a given statement, there is a definite order in responses, but there is no evidence that the distance between an answer of 1 (strongly agree) and 2 (agree) is the same as the distance between 2 (agree) and 3 (neutral). There is just no evidence for interpreting the magnitude of the difference between numbers or th...
Table of contents
Cover
Half Title
Publisher Note
Title Page
Copyright Page
Acknowledgements
Contents
About the author
About the online resources
Acknowledgements
Introduction
Part One Understanding quantitative data and R
1 Introduction to information, knowledge and quantitative data
2 An introduction to R and RStudio
Part Two Data visualisation
3 Graphical representation of data
Part Three Providing information about data
4 Descriptive statistics
5 Measures of dispersion and distributions
6 Normal distribution and standardised scores
Part Four Making estimations and predictions from data
7 Fundamentals of inferential statistics
8 Estimation and hypothesis testing
Part Five From sample to population
9 One-sample tests
10 Differences between two independent or dependent samples
11 Differences between more than two independent samples
12 Differences between more than two dependent samples
Part Six Relationships and predictions
13 Relationships between variables
14 Predictions for independent and dependent variables
Bibliography
Index
Frequently asked questions
Yes, you can cancel anytime from the Subscription tab in your account settings on the Perlego website. Your subscription will stay active until the end of your current billing period. Learn how to cancel your subscription
No, books cannot be downloaded as external files, such as PDFs, for use outside of Perlego. However, you can download books within the Perlego app for offline reading on mobile or tablet. Learn how to download books offline
Perlego offers two plans: Essential and Complete
Essential is ideal for learners and professionals who enjoy exploring a wide range of subjects. Access the Essential Library with 800,000+ trusted titles and best-sellers across business, personal growth, and the humanities. Includes unlimited reading time and Standard Read Aloud voice.
Complete: Perfect for advanced learners and researchers needing full, unrestricted access. Unlock 1.4M+ books across hundreds of subjects, including academic and specialized titles. The Complete Plan also includes advanced features like Premium Read Aloud and Research Assistant.
Both plans are available with monthly, semester, or annual billing cycles.
We are an online textbook subscription service, where you can get access to an entire online library for less than the price of a single book per month. With over 1 million books across 990+ topics, we’ve got you covered! Learn about our mission
Look out for the read-aloud symbol on your next book to see if you can listen to it. The read-aloud tool reads text aloud for you, highlighting the text as it is being read. You can pause it, speed it up and slow it down. Learn more about Read Aloud
Yes! You can use the Perlego app on both iOS and Android devices to read anytime, anywhere — even offline. Perfect for commutes or when you’re on the go. Please note we cannot support devices running on iOS 13 and Android 7 or earlier. Learn more about using the app
Yes, you can access Understanding Quantitative Data in Educational Research by Nicoleta Gaciu in PDF and/or ePUB format, as well as other popular books in Éducation & Recherche dans l'éducation. We have over one million books available in our catalogue for you to explore.