eBook - ePub
Occlusal Splints for Painful Craniomandibular Dysfunction
- 183 pages
- English
- ePUB (mobile friendly)
- Available on iOS & Android
eBook - ePub
Occlusal Splints for Painful Craniomandibular Dysfunction
About this book
Therapy for painful craniomandibular dysfunction (CMD) is a field of dentistry that is quite different from traditional subjects in dental medicine (eg, periodontics, restorative dentistry, or oral surgery). In these subject areas, innovation essentially means adapting clinical procedures to new technologies, such as the use of digital resources. However, better basic treatment of CMD cases cannot be achieved simply by better technique but by a new way of thinking that emphasizes patients, their suffering, and what they tell their dentists. Therefore, this book offers a clear guide to help practitioners address the issue of CMD in theory and practice and provide their CMD patients with the best possible treatment. The book is split into two parts: first a practical guide to the basic treatment of CMD patients, followed by chapters that build on that basic knowledge by exploring scientific and theoretical principles in more depth. The two parts complement each other to form a rounded and complete picture. A series of detailed charts, diagrams, and sample forms are included to supplement the important history-taking section, and chapters on splint fabrication and rehabilitation include step-by-step photographs. The book concludes with chapters on neurobiology to discuss CMDs and their treatment at an anatomical level for a more thorough understanding.
Tools to learn more effectively

Saving Books

Keyword Search

Annotating Text

Listen to it instead
Information
Part B
Aspects of Painful CMD and Splint Therapy Explored in Depth
6
RISKS
Jens C. Türp, Hans J. Schindler, Alfons Hugger, and Marc Schmitter
Definition of Risk
The etymology of the word “risk” from the Italian “rischio” is a matter of debate. An Ancient Greek, pre-Roman, and Arabic derivation have all been discussed.1,2 Thus, “risk” refers to uncertainty in two respects: etymologically and in terms of definition.
In clinical epidemiology, risk is understood to mean the probability that “a certain disease will develop later with greater frequency in people who are exposed to certain factors (“factors of risk”*) than in comparable people who are not exposed to those factors.”3 With reference to myoarthropathic or CMD pain, this means the probability that people exposed to defined risk factors will later exhibit pains of the masticatory muscles or temporomandibular joints (TMJs) with greater frequency than comparable people who are not exposed to these factors.
Definition, Calculation, and Interpretation of Odds Ratio
For dichotomous data (yes/no), the odds ratio (OR)† is a measure of descriptive statistics with which the size of this “quantifiable uncertainty”4 can be estimated. This measure of association originating from analytical epidemiology involves the quotients of two chances (odds).‡
OR entered into specialist medical literature in the early 1980s. Risk-related ORs are calculated from data obtained in observational studies, ie, from prospective cohort studies, case-control studies, and cross-sectional studies.
The ratio between the chance of disease for exposed individuals and the chance of disease for nonexposed subjects is ascertained in prospective cohort studies (follow-up studies, incidence studies). From a cohort without disease, the number of participants exposed to a potential risk factor and those not exposed is established at the start of the study. The groups are then observed over a specified period of time. Thereafter, the number of people with disease is determined from among the exposed and nonexposed participants.3 In this way, the factors that make the eventual occurrence of a defined disease more probable can be identified.
Example: 1,310 11-year-old boys and girls living in the state of Washington who did not have orofacial pains were interviewed about the presence of facial pain (among other questions) every 3 months over a minimum time of 3 months and maximum of 3 years. Those who gave a positive reply were examined and diagnosed at home.7 Children who reported a low level of general life satisfaction at the start of the study had a four times higher chance of myoarthropathic or CMD pains during the course of the study than children who were very satisfied with their lives (OR: 4.22; 95% confidence interval [CI]: 2.0–8.7).
In case-control studies, by contrast, the ratio between the chance of exposure of diseased individuals (cases) and the chance of exposure of nondiseased individuals (controls) is determined: At the start of the study, the number of identified cases and the number of controls (matched as closely as possible to the ill cases in terms of age, gender, general health, dental health, and other factors) is established. How many diseased and nondiseased individuals were exposed to the potential risk factor is determined retrospectively, eg, by questionnaires or records from patients’ case notes.8,9
Example: In the Dentistry Clinic of Naples University, Michelotti et al10 questioned 408 patients with and 111 people without pains of the muscles of mastication. The chance of a person with masticatory muscle pains answering “yes” when asked whether they kept their teeth in contact during the day, exhibited jaw clenching, or ground their teeth was nearly five times higher than in people without myalgia (OR: 4.9; 95% CI: 3.06–7.84).
One problem with case-control studies is that they cannot identify whether the suspected factor of risk was already present before the masticatory muscle pains began or did not arise until after the onset of the pains.11
Definition
An OR calculated from a prospective cohort study should be interpreted as the factor by which the chance of getting a disease increases in a group with exposure (the possible risk factor) compared to a group without exposure. Conversely, an OR calculated from a case-control study should be interpreted as the factor by which the chance of having been exposed to the potential risk factor increases in a group with preexisting disease compared to a group without disease.11
The strength of an association is described by the OR. However, the mere presence of a strong association is not proof of a cause-and-effect relationship.11,12*
Calculation
Calculation of an OR can be graphically depicted with a four-field table (cross-table, 2×2 table) (Tables 6-1 and 6-2).13 An OR cannot have a negative value; the values range from zero to positive infinity.14
Table 6-1 Four-field table (with field identifiers) for a prospective cohort study
Get disease | Do not get disease | |
|---|---|---|
Exposed healthy subjects | a | b |
Nonexposed healthy subjects | c | d |
The chance of getting a disease is a/b for the exposed subjects (people with potential risk factor), c/d for the nonexposed. The chance ratio is:
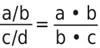
Table 6-2 Four-field table (with field identifiers) for a case-control study
Have been exposed | Have not been exposed | |
|---|---|---|
Diseased subjects (cases) | a | b |
Nondiseased subjects (controls) | c | d |
The chance of getting a disease is a/b for the cases, c/d for the controls. The chance ratio is again:

Interpretation
An OR of 1 means that there is no association between exposure and disease (or disease and exposure). The more the OR exceeds the number 1, the stronger any such association will be. A high OR in prospective cohort studies, therefore, means that there is an increased chance of the disease occurring in the case of exposure; however, that does not necessarily mean that the person concerned will get the disease.3 An OR < 1, on the other hand, indicates a reduced chance of the disease occurring, ie, pointing to a protective or preventive (health-promoting) effect upon exposure. An OR is generally seen as a clinically relevant indicator of risk if it is > 2 (= disease-promoting) or < 0.5 (= protective).15†
Confidence Interval
An OR always refers to the results of the study from which it was calculated. As the numeric values for ORs stated in study articles are sample-related point estimates for the unknown true value in the population from which the sample originates, the concomitant inaccuracy needs to be quantified. This is usually achieved by a confidence interval being calculated around the point estimate calculated in that particular study.3,8
Within current evidence-based medicine, it is deemed necessary to state confidence intervals because they allow for a quantifiable estimate of the uncertainty of a study result.12,18 In dental and medical specialist literature, confidence intervals have been quoted increasingly since the mid-1980s19 but not as yet to the desired extent.20,21
When presenting results from clinical trials, it is usual to quote a 95% confidence interval (calculated from the data for the particular sample). The true value for the basic population lies within this range with a probability of 95% (in an undistorted study, ie, with no...
Table of contents
- Cover
- Title page
- Copyright page
- Contents
- Foreword
- Preface
- Contributors
- Part A Practice of Occlusal Splint Therapy and Coordinative Training
- Part B Aspects of Painful CMD and Splint Therapy Explored in Depth
- INDEX
- Back Cover
Frequently asked questions
Yes, you can cancel anytime from the Subscription tab in your account settings on the Perlego website. Your subscription will stay active until the end of your current billing period. Learn how to cancel your subscription
No, books cannot be downloaded as external files, such as PDFs, for use outside of Perlego. However, you can download books within the Perlego app for offline reading on mobile or tablet. Learn how to download books offline
Perlego offers two plans: Essential and Complete
- Essential is ideal for learners and professionals who enjoy exploring a wide range of subjects. Access the Essential Library with 800,000+ trusted titles and best-sellers across business, personal growth, and the humanities. Includes unlimited reading time and Standard Read Aloud voice.
- Complete: Perfect for advanced learners and researchers needing full, unrestricted access. Unlock 1.4M+ books across hundreds of subjects, including academic and specialized titles. The Complete Plan also includes advanced features like Premium Read Aloud and Research Assistant.
We are an online textbook subscription service, where you can get access to an entire online library for less than the price of a single book per month. With over 1 million books across 990+ topics, we’ve got you covered! Learn about our mission
Look out for the read-aloud symbol on your next book to see if you can listen to it. The read-aloud tool reads text aloud for you, highlighting the text as it is being read. You can pause it, speed it up and slow it down. Learn more about Read Aloud
Yes! You can use the Perlego app on both iOS and Android devices to read anytime, anywhere — even offline. Perfect for commutes or when you’re on the go.
Please note we cannot support devices running on iOS 13 and Android 7 or earlier. Learn more about using the app
Please note we cannot support devices running on iOS 13 and Android 7 or earlier. Learn more about using the app
Yes, you can access Occlusal Splints for Painful Craniomandibular Dysfunction by Hans Jürgen Schindler,Jens Christoph Türp in PDF and/or ePUB format, as well as other popular books in Medicine & Dentistry. We have over one million books available in our catalogue for you to explore.