Third-variable effect refers to the effect transmitted by third-variables that intervene in the relationship between an exposure and a response variable. Differentiating between the indirect effect of individual factors from multiple third-variables is a constant problem for modern researchers.
Statistical Methods for Mediation, Confounding and Moderation Analysis Using R and SAS introduces general definitions of third-variable effects that are adaptable to all different types of response (categorical or continuous), exposure, or third-variables. Using this method, multiple third- variables of different types can be considered simultaneously, and the indirect effect carried by individual third-variables can be separated from the total effect. Readers of all disciplines familiar with introductory statistics will find this a valuable resource for analysis.
Key Features:
Parametric and nonparametric method in third variable analysis
Multivariate and Multiple third-variable effect analysis
Multilevel mediation/confounding analysis
Third-variable effect analysis with high-dimensional data Moderation/Interaction effect analysis within the third-variable analysis
R packages and SAS macros to implement methods proposed in the book
A simple third-variable effect refers to the effect of a third-variable in explaining the observed relationship between an exposure variable and an outcome. Denote the third-variable as M, the exposure variable as X and the outcome as Y. The third-variable effects presented in this book are in one of the three formats: confounding, mediation and interaction/moderation. The third-variable is called a confounder or a mediator if it meets the following two conditions:
The third-variable is a risk factor to the outcome.
The third-variable is associated with the exposure variable.
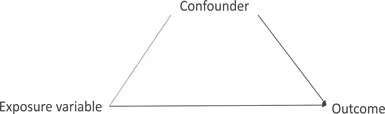
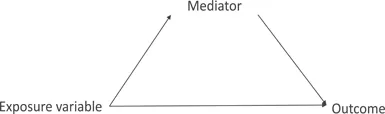
Depending on whether the third-variable is in the causal pathway between the exposure and the outcome, the third-variable is called a mediator or a confounder. Figures 1.1 and 1.2 show the diagrams of a simple confounding effect and mediation effect separately. A line with an arrow indicates a causal relationship between the two related variables where the variable at the arrow head is caused by the variable at the other end of the line. A line without an arrow indicates that the two variables are associated but no causal relationship is established. The third-variable is called a mediator if there is a causal relationship between the exposure and the third-variable. Otherwise, the third-variable is a confounder.
FIGURE1.1Confounding effect diagram.
FIGURE1.2Mediation effect diagram.
Another type of third-variable effect is called the moderation/interaction effect, where at different level of the variable, the associations among the exposure, other third-variables, and the outcome are different. Figure 1.3 shows the diagram of a simple direct moderation/interaction effect. In a linear regression model, this association can be presented as an interaction term of the moderator and the exposure variable in explaining the outcome.
FIGURE1.3Moderation/interaction effect diagram.
When there are multiple third-variables, the associations among variables can become more complicated. For example, the interaction effect can be between the moderator and another third-variable on the outcome; or between the moderator and the exposure variable on another third-variable. That is, there are different types of moderation effects. We discuss the different moderation effects and their inferences in Chapter 9.
1.2 Motivate Examples for Making Inferences on Third-Variable Effects
The major types of third-variable effect include confounding, mediation and moderation. In this section, we give a few examples showing the importance of making inferences on third-variable effects.
1.2.1 Evaluate Policies and Interventions
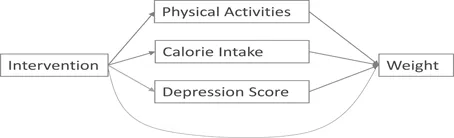
Often times, policies or interventions are designed to regularize human behavior or to treat certain diseases. For each intervention, there is usually a conceptual hypothesis of how it works. For example, an intervention for controlling weight may aim at helping people 1) increase physical activities, 2) have healthier food intake and 3) have better mood. To assess the effectiveness of the intervention, we have the following hypothesis to test:
The intervention is effective in reducing weight.
The intervention helps people reduce weight by increasing their physical activities.
The intervention helps people reduce weight by reducing their intake of calories.
The intervention helps people reduce weight by improving their mental health.
As measurements, the unit of reduced weight is the ounce of weight, which is the difference in the weight before and after the intervention. The amount of physical activities is measured by the average number of hours of physical activities per day. The mental status is measured by the Patient Reported Outcomes Measurement Information System (PROMIS) depression score, which is standardized to have a mean 50 and an overall standard deviation of 10. A higher depression score indicates a higher level of depression. All the measurements are taken before and after the one-month intervention. The calorie intake is measured by average daily calorie intake through a survey that records the food and drink taken in the past few days. There are other variables such as age, gender and education levels that are measured as control variables.
According to the study hypothesis, the conceptual model is shown in Figure 1.4. We are interested to estimate the effect from each different path connecting intervention and weight, and make inferences on whether each effect is significant or not. For the study hypothesis, we would like to see if the effect from each path is significantly different from 0. In addition, we want to compare and rank effects from different paths, so we know the strength and weakness of the intervention. Furthermore, we would like to know how each variable helps in changing the weight. For example, how efficient it is to increase physical activities in reducing weight. It is likely that the first half an hour's increase in physical activities might significantly help reduce weight, but the reduction may not be as substantial for the second half hour's increase of physical activity. That is, the relationship among variables might not be linear. There can be a bottleneck where further addition of physical activities cannot help much in reducing weights. We would like to know how much physical activity per day is most efficient and beneficial for individuals. All these questions can be answered by the third-variable effect analysis.
FIGURE1.4Conceptual model for weight intervention.
1.2.2 Explore Health Disparities
Health disparities are prevalent in the United States. Minorities suffer disproportionally from many poor health outcomes. For example, despite growing awareness of the negative health impacts of poor diet, physical inactivity and excess weight, the prevalence of obesity has increased dramatically in the United States (US). Hispanic and African Americans suffer disproportionately from obesity and related chronic diseases. Analysis of 2003-2006 National Health and Nutrition Examination Survey (NHANES) data shows that 44.3% of adult blacks and 30.2% of whites were obese. During the last three decades, research by the National Center for Health Statistics (NCHS) using NHANES shows that the US obesity rate doubled in adults and tripled in youth. Ethnic/racial disparities in obesity-related chronic diseases are also worsened. Diabetes prevalence increased 33.3% in whites, compared to 60.0% in blacks and 227.3% in Mexican Americans in the last decade. Mechanisms explaining these disparities are poorly understood. Both neighborhood and individual-level risk factors such as neighborhood walkability and individual physical activity behavior are shown to contribute to these racial/ethnic disparities.
By examining these potential explanatory factors from different levels (individual or neighborhood) jointly and differentiating the relative effects on racial/ethnic disparities, researchers are able to provide information to support targeted and precision medicine efforts. Moreover, such information is essential for public health officials and health care agencies in their efforts to develop efficient intervention strategies to reduce racial/ethnic disparities with limited resources. Third-variable effect analysis provides ways to identify important risk factors that explain the health disparities. It also helps differentiate and estimate effect of different factors from various levels (e.g. individual behavior and physical environment). With the analysis, we can also answer questions like: if we can manipulate such that the walkability for residential areas are equivalent for blacks and whites, what proportion of the racial difference in obesity could be reduced?
1.2.3 Exam the Trend of Disparities
An example of moderation effect is on monitoring the trend of disparity in health outcomes. Breast cancer is the most commonly diagnosed cancer for American women of all races. It is also the second leading cause of cancer death. Breast cancer has been categorized into subgroups for prognosis and treatment purposes. One common way of classifying breast cancer and recommending treatment is based on the expression of estrogen receptor (ER), progesterone receptor (PR), and human epidermal growth factor receptor 2 (HER 2) [7]. The subtype ER positive and/or PR positive (ER+/PR+) and HER2 negative (HER2-) breast cancer is the most common subtype, has the best prognosis and responds well to adjuvant endocrine therapy and/or chemotherapy. However, even within this subtype, patients have different recurrence risk and may respond to chemotherapy differently [54, 55].
Precision medicine has been developed significantly in today's cancer treatment. Oncotype DX® (ODX) is a genomic test that can differentiate ER+/PR+ and HER2- patients by the risk of recurrence to project prognosis and chemotherapy benefit. ODX test is based on 21-gene expression levels and it produces a recurrence score, a number between 0 and 100. A raised ODX score indicates a higher probability of cancer recurrence and more benefit from chemotherapy. The National Comprehensive Cancer Network (NCCN) cancer treatment guidelines published in 2008 recommended ODX test to patients with ER+/PR+, HER2-, and negative lymph node breast cancer to identify those that are more likely to benefit from chemotherapy. However, research shows that there are racial and ethnic disparities among breast cancer patients in terms of the survival rate, recurrence rate, and health-related quality of life [84, 86]. The disparity was also discovered in the use of ODX test [63, 40, 61]. Our previous work has shown that among all female breast cancer patients who were considered to be able to benefit from the ODX exam, non-Hispanic whites had a significantly higher rate of using the test, compared with non-Hispanic blacks [90]. In addition, the proportion of using ODX tests has been increasing over the last decade within both black and white patients. It is interesting to know whether the racial gap in ODX test has been reduced over time during the last decade. Furthermore, if there is a reduction in the gap, what factors contribute to this improvement? These questions can be answered through the third-variable-effect analysis.
1.3 Organization of the Book
For the rest of the book, we present the following contents. In Chapter 2, we review traditional methods of mediation and confounding analysis. We focus on two frameworks of research: regression models and the counterfactual framework. Then in Chapter 3, we review the advanced statistical modeling and machine learning techniques that are used in the third-variable analysis methods introduced in the book. Chapter 4 introduces general concepts of direct and indirect effects (Section 4.2), and proposes algorith...
Table of contents
Cover Page
Half-Title Page
Title Page
Copyright Page
Dedication Page
Contents
Preface
Symbols
1 Introduction
2 A Review of Third-Variable Effect Inferences
3 Advanced Statistical Modeling and Machine Learning Methods Used in the Book
4 The General Third-Variable Effect Analysis Method
5 The Implementation of General Third-Variable Effect Analysis Method
6 Assumptions for the General Third-Variable Analysis
7 Multiple Exposures and Multivariate Responses
8 Regularized Third-Variable Effect Analysis for High-Dimensional Dataset
9 Interaction/Moderation Analysis with Third-Variable Effects
10 Third-Variable Effect Analysis with Multilevel Additive Models
11 Bayesian Third-Variable Effect Analysis
12 Other Issues
Appendices
Bibliography
Index
Frequently asked questions
Yes, you can cancel anytime from the Subscription tab in your account settings on the Perlego website. Your subscription will stay active until the end of your current billing period. Learn how to cancel your subscription
No, books cannot be downloaded as external files, such as PDFs, for use outside of Perlego. However, you can download books within the Perlego app for offline reading on mobile or tablet. Learn how to download books offline
Perlego offers two plans: Essential and Complete
Essential is ideal for learners and professionals who enjoy exploring a wide range of subjects. Access the Essential Library with 800,000+ trusted titles and best-sellers across business, personal growth, and the humanities. Includes unlimited reading time and Standard Read Aloud voice.
Complete: Perfect for advanced learners and researchers needing full, unrestricted access. Unlock 1.4M+ books across hundreds of subjects, including academic and specialized titles. The Complete Plan also includes advanced features like Premium Read Aloud and Research Assistant.
Both plans are available with monthly, semester, or annual billing cycles.
We are an online textbook subscription service, where you can get access to an entire online library for less than the price of a single book per month. With over 1 million books across 990+ topics, we’ve got you covered! Learn about our mission
Look out for the read-aloud symbol on your next book to see if you can listen to it. The read-aloud tool reads text aloud for you, highlighting the text as it is being read. You can pause it, speed it up and slow it down. Learn more about Read Aloud
Yes! You can use the Perlego app on both iOS and Android devices to read anytime, anywhere — even offline. Perfect for commutes or when you’re on the go. Please note we cannot support devices running on iOS 13 and Android 7 or earlier. Learn more about using the app
Yes, you can access Statistical Methods for Mediation, Confounding and Moderation Analysis Using R and SAS by Qingzhao Yu,Bin Li in PDF and/or ePUB format, as well as other popular books in Matematica & Probabilità e statistica. We have over one million books available in our catalogue for you to explore.