- English
- ePUB (mobile friendly)
- Available on iOS & Android
eBook - ePub
Statistical Analyses for Language Testers
About this book
Provides a step-by-step approach to the most useful statistical analyses for language test developers and researchers using IBM SPSS, Winsteps and Facets. It contains clearly-worked out examples for each analysis with detailed explanations.
Tools to learn more effectively

Saving Books

Keyword Search

Annotating Text

Listen to it instead
Information

1
Data Entry
In this chapter you will be introduced to the Statistical Package for Social Sciences (SPSS). Depending on the version you are using you may see some minor differences in how the data are displayed in this book (which is based on version 21 of SPSS) and how they appear on your own screen.

Before starting data entry, we need to think about the different types of variables we will come across in this and future chapters. The main ones are listed below:
Continuous: This type of variable consists of interval data, such as scores on a test, or ratio data (those which have a fixed zero point), such as weight or temperature measurements in Kelvin. It is made up of numeric data only.
Ordinal: This type of variable is made up of data which represent categories with some type of intrinsic order, for example, questionnaire data which uses a Likert-type scale (very difficult to very easy). It can accept both string (letters) and numeric data.
Nominal: This type of variable comprises data which represent mutually exclusive categories with no intrinsic order, for example, nationality (Spanish) or gender (female). The data can be string (Spanish), alphanumeric (cand01) or numeric (888).
Two other types of variables which you will meet later in this book are:
Dependent and independent variables (see Chapter 6 onwards):
A dependent variable is usually made up of scores on a test or responses to a Likert-type scale in a feedback or attitudinal questionnaire. An independent variable is one which we manipulate in order to see in what way the dependent variable might change. For example, we might want to look at the relationship between the gender of a test taker (independent variable) and his / her performance on a test (dependent variable). In such a case, gender would be a nominal independent variable (female or male) and the test taker’s performance would be a continuous dependent variable (his / her score on a test).
It is important to think about what independent variables you might be interested in, for example gender, nationality, mother tongue or number of years studying English, and collect these at the same time that you administer your test or questionnaire. These variables are often related to the research questions you want to ask of your data.
In this chapter you will:
►Be introduced to the Data View Window (DVW) and the DVW toolbar.
►Learn how to:
♦enter variable details in the Variable View Window (VVW).
♦enter data in the DVW.
♦insert / move / delete and copy data.
♦save a SPSS data file and leave SPSS.
Stage 1: The Data View Window (DVW)
To open SPSS, find the appropriate icon on your desktop and click on it. When the package opens, you will see the toolbar shown in Figure 1.1:

Figure 1.1
The toolbar consists of a number of drop-down menus offering a range of options as shown in Figure 1.2:
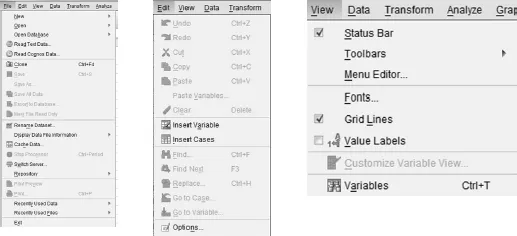

Figure 1.2
Some menus offer further sub-menus, particularly the Analyze menu, and we will meet many of these options in other chapters. Underneath the headings in the DVW is a row of icons representing the most commonly used shortcuts in SPSS (see Figure 1.3). If you hover your mouse over the icon, the individual function will be revealed:
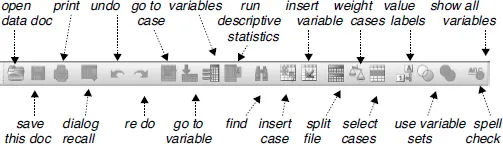
Figure 1.3
At the bottom of the SPSS DVW is a bar known as the status bar. The words ‘IBM SPSS Statistics Processor is ready’ usually appear on this bar unless the program is processing a command. For example, if you ask SPSS to run Frequencies, the words ‘Running Frequencies’ will appear.
As you will have observed, the DVW is a spreadsheet made up of cells. In Figure 1.4, for example, we can see information about the first six test takers in a data set:
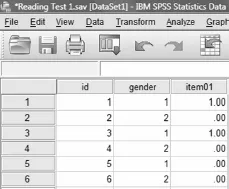
Figure 1.4
The rows tell us about each test taker (1 through 6) while the columns provide information about their identification number, gender and performance on item01. For example, test taker no 1 has gender 1 and answered item01 correctly (1.00).
Stage 2: Entering a dataset (1)
SPSS has two spreadsheet-like windows – one is the DVW (described in Stage 1) and the other is the VVW. You can move between them by using the tabs at the bottom of the screen (see Figure 1.5).

Figure 1.5
The VVW contains the following headings (see Figure 1.7):
►Name: here you should enter the name of each variable in your data file – for example, the first might be id, the second might be gender and so on.
►Type: the type of data that you wish to put in the cell (see Figure 1.6).
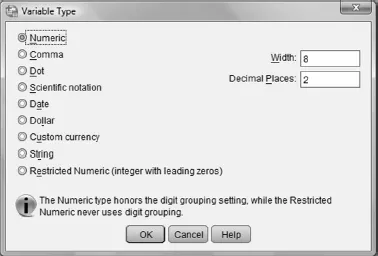
Figure 1.6
Although there are several options, the most commonly used types are:
►Numeric: used for data made up of numbers only, for example, 1, 49 and so on.
►String: used for data made up of text / or numbers and text. For example, Cand01, v2 and so on.
The default variable type is Numeric, with room for eight numbers, two of which are assumed to be decimal places. In other words, SPSS expects the data to be in this format unless you define them in another way. Decimal places can be removed at any time in the VVW. If you wish to make changes to the default settings in SPSS on a more permanent basis, go to Edit → Options.
It is recommended that numeric variables are used as far as possible as SPSS can only run a limited number of analyses on string variables. So, for example, if you have information about the test takers’ gender, nationality and first language which you might want to use in later analyses as an independent variable, it makes sense to code them and enter these data as numeric variables (see Chapters 7 and 8).
►Width: width of the cell – the default in SPSS is 8 spaces.
►Decimals: the number ...
Table of contents
- Cover
- Title Page
- 1 Data Entry
- 2 Checking and Correcting Data Files
- 3 Item Analysis
- 4 Descriptive Statistics
- 5 Analysing Test Taker Feedback
- 6 Comparing Performance I: Means, Scatterplots and Correlations
- 7 Comparing Performance II: Parametric and Non-Parametric Analyses
- 8 Comparing Performance III: ANOVA
- 9 Factor Analysis
- 10 Creating a Control File and Convergence Table
- 11 Analysing the Convergence Table and Creating a Variable Map
- 12 Item and Person Statistics
- 13 Distracter Analysis
- 14 Creating and Running a Specifications File
- 15 Analysing the Iteration Report and Vertical Ruler
- 16 Rater and Item Measurement Reports
- Appendix 1 Data Files
- Appendix 2 Data Spreadsheet
- Appendix 3 Item Analysis
- Appendix 4 Descriptive Statistics
- Appendix 5 Comparing Performance I: Means, Scatterplots and Correlations
- Appendix 6 Comparing Performance II: Parametric and Non-Parametric Analyses
- Appendix 7 Comparing Performance III: ANOVA
- Appendix 8 Factor Analysis
- Appendix 9 Creating a Control File, Convergence Table and Variable Map
- Appendix 10 Item and Person Statistics
- Appendix 11 Distracter Analysis
- Appendix 12 Creating a Specifications File, Iteration Report and Vertical Ruler
- Appendix 13 Rater and Assessment Criteria Measurement Reports
- References and Further Reading
- Index
Frequently asked questions
Yes, you can cancel anytime from the Subscription tab in your account settings on the Perlego website. Your subscription will stay active until the end of your current billing period. Learn how to cancel your subscription
No, books cannot be downloaded as external files, such as PDFs, for use outside of Perlego. However, you can download books within the Perlego app for offline reading on mobile or tablet. Learn how to download books offline
Perlego offers two plans: Essential and Complete
- Essential is ideal for learners and professionals who enjoy exploring a wide range of subjects. Access the Essential Library with 800,000+ trusted titles and best-sellers across business, personal growth, and the humanities. Includes unlimited reading time and Standard Read Aloud voice.
- Complete: Perfect for advanced learners and researchers needing full, unrestricted access. Unlock 1.4M+ books across hundreds of subjects, including academic and specialized titles. The Complete Plan also includes advanced features like Premium Read Aloud and Research Assistant.
We are an online textbook subscription service, where you can get access to an entire online library for less than the price of a single book per month. With over 1 million books across 990+ topics, we’ve got you covered! Learn about our mission
Look out for the read-aloud symbol on your next book to see if you can listen to it. The read-aloud tool reads text aloud for you, highlighting the text as it is being read. You can pause it, speed it up and slow it down. Learn more about Read Aloud
Yes! You can use the Perlego app on both iOS and Android devices to read anytime, anywhere — even offline. Perfect for commutes or when you’re on the go.
Please note we cannot support devices running on iOS 13 and Android 7 or earlier. Learn more about using the app
Please note we cannot support devices running on iOS 13 and Android 7 or earlier. Learn more about using the app
Yes, you can access Statistical Analyses for Language Testers by R. Green in PDF and/or ePUB format, as well as other popular books in Social Sciences & Teaching Languages. We have over one million books available in our catalogue for you to explore.