Following the Great Financial Crisis, the S&P 500 advanced more than 17 percent annualized from February 2009 through June 2018. At this pace, a buy-and-hold investor in the stock market would see their money double in 5 years and more than triple in 7 years. This performance has lulled many investors into thinking that such above-average returns will be with us into perpetuity. Unfortunately, this may not be the case. Far more likely, the return an investor may receive from the stock market will be slightly better than half the long-term average, about 5% to 7%.
Most investment portfolios hold a greater allocation to stocks than any other class of investment asset. Massive amounts of wealth were created from the bull market since early 2009 providing institutions and individuals with a rising tide that lifted their portfolios above their goals without much effort. The environment of the future stands to be far less accommodating, so finding suitable investments (other than U.S. stocks) that can achieve the necessary returns (or make up the shortfall) will be a critical component of achieving goals in years to come. This book will explore those solutions.
Frequently asked questions
Simply head over to the account section in settings and click on “Cancel Subscription” - it’s as simple as that. After you cancel, your membership will stay active for the remainder of the time you’ve paid for. Learn more here.
At the moment all of our mobile-responsive ePub books are available to download via the app. Most of our PDFs are also available to download and we're working on making the final remaining ones downloadable now. Learn more here.
Both plans give you full access to the library and all of Perlego’s features. The only differences are the price and subscription period: With the annual plan you’ll save around 30% compared to 12 months on the monthly plan.
We are an online textbook subscription service, where you can get access to an entire online library for less than the price of a single book per month. With over 1 million books across 1000+ topics, we’ve got you covered! Learn more here.
Look out for the read-aloud symbol on your next book to see if you can listen to it. The read-aloud tool reads text aloud for you, highlighting the text as it is being read. You can pause it, speed it up and slow it down. Learn more here.
Yes, you can access Success in a Low-Return World by Michael J. Oyster in PDF and/or ePUB format, as well as other popular books in Negocios y empresa & Finanzas. We have over one million books available in our catalogue for you to explore.
Michael J. OysterSuccess in a Low-Return Worldhttps://doi.org/10.1007/978-3-319-99855-8_1
Begin Abstract
1. The Future Isn’t What It Used to Be
Michael J. Oyster1
(1)
Chief Investment Strategist, Cincinnati, OH, USA
Michael J. Oyster
End Abstract
Why do we invest? Why do we deploy capital into a marketplace with the risk of loss? In most cases, the main reason is to have more money than we have today at some future date. There have been times when bonds have been great for generating regular income, but most people who need their money to grow rely on stocks. For many years, investors seeking asset growth have placed their trust in large cap stocks and, assuming they remained invested long enough, these investors have usually been rewarded.
At the most fundamental level, stocks are ownership shares in companies. Stock prices generally ascend through time as the economy grows, with companies reaping the benefits of improved efficiency and technology. Barring worldwide economic collapse and a termination of all technological advancement, the economy should continue to grow (save the occasional recession), and stock prices will continue to rise. An investment in stocks will not grow all the time, but we can expect that it will grow over time.
Disregarding the specific stock investment for the moment, let’s focus on the market in general; in this case, the US market of large cap stocks. An investment in the stock market, regardless of how and where it is made, will be impacted by factors that affect the market as a whole. In fact, most of the feast or famine an investor actually experiences is caused by movements of the stock market, while only a fraction of their total return is due to the unique characteristics of the investment itself. Therefore, we need to know a few things about the US stock market before we invest there. The amount of wealth we will see at some future date depends highly on what happens to the market in general.
Even if you include the bear market in stocks surrounding the Great Financial Crisis (GFC), many of today’s investors have enjoyed one of the healthiest bull markets in history. Nevertheless, past performance may be giving investors a false sense of optimism. In the same way that those who don’t understand history are doomed to repeat it, investors (as well as the professionals who advise them) must understand that the recent past has been far better than the long-term past, and quite possibly, better than the future will be as well. Although tempting, projecting the short-term past into forecasts of the future may result in a painful bear market in expectations, in that what you ultimately earn is far less than what you expected.
Stock Market Performance Building Blocks
No one can consistently and accurately predict the future movements of the stock market, but we can look at the building blocks that produce its performance. As complex as stock markets are, the total return of the major indexes can be boiled down to just three things:
1.
Earnings growth (including inflation)
2.
Dividend yields
3.
Changes in price (price-earnings or P/E ratio)
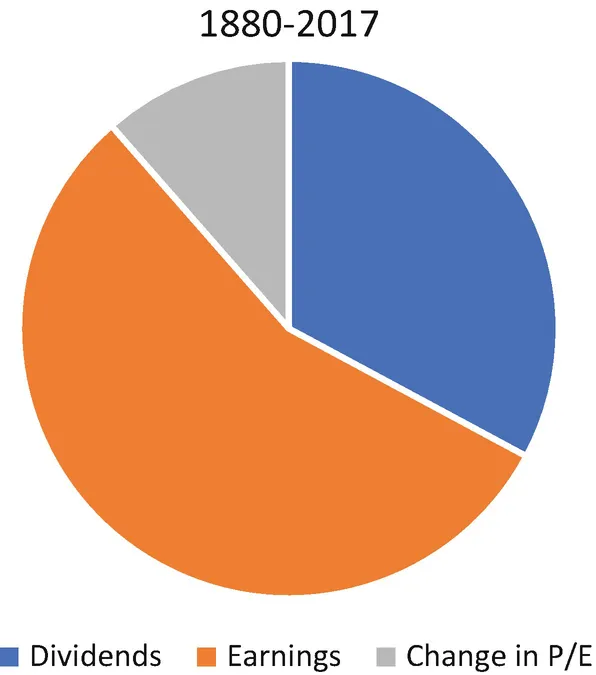
Some investors break out earnings growth into real growth and inflation and/or consider the market impact of share buybacks separately, but for our purposes, we will focus on these three building blocks. A value for each exists for every stock in a market, so when looking at the total market, we can add all three for all of the stocks in that particular market. The sum of the three building blocks represents the market’s total return. Certainly the global investment universe is comprised of multiple marketplaces, but for the purpose of discussion here, the term “market” is large cap stocks in the United States, generally represented by the Standard & Poor’s 500 Index (S&P 500). The approximate relative contribution from each of the three building blocks for the S&P 500 (the market) from 1880 through 2017 has been as follows (Fig. 1.1).
Fig. 1.1
Approximate Contributions to US Stock Market Total Return, 1880–2017. Data source: Robert Shiller, Stock Market Data Used in Irrational Exuberance, Princeton University Press, updated 2000, 2005, 2015
Notice how earnings, the largest contributor, represented over half of the long-term return.
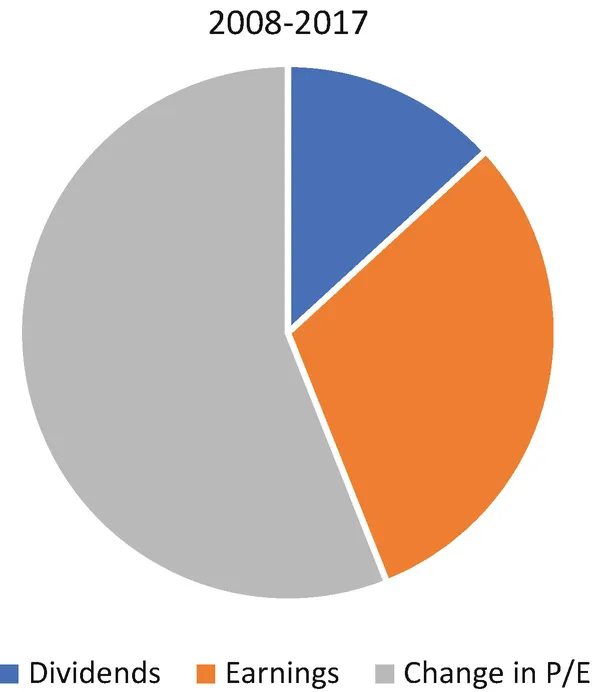
The influence of the same three building blocks is shown below, only this time they represent their respective contributions to the market’s total return during a period of exceptionally strong performance, 2008 through 2017 (Fig. 1.2).
Fig. 1.2
Approximate Contributions to US Stock Market Total Return, 2008–2017. Data source: Robert Shiller, Stock Market Data Used in Irrational Exuberance, Princeton University Press, updated 2000, 2005, 2015
Although change in price, P/E expansion, was the least important contributor to the stock market’s total return since 1880, it was the most important one from 2008 through 2017. Dividends and earnings were relatively stable, while an expanding P/E ratio drove returns. So not only can we boil stock market returns down to three data points, we only need one of them, P/E expansion, to explain the nearly decade-long bull market through 2017. If P/E expansion coincided with tremendous stock market returns, how might a contraction affect performance and how might that come about? Before answering those questions, let’s first look back at the building and then the bursting of the technology and telecom stock bubble of the late-1990s.
P/E Ratios and the Bull Market of the 1990s
In May 1982, the S&P 500 Index was priced barely more than seven times earnings. At this level stocks were selling at fire sale prices. By the time the technology-driving bull market of the late 1990s was coming to an end, the P/E ratio had risen to over 30, its highest level ever.
Why did stocks become so pricey? Demographics certainly played a role. From 1976 through 1996, the number of Americans in the workforce between the ages of 35 and 54 (prime saving and stock-buying years) rose by more than 80 percent.1 Just as in any auction, the greater the demand for something, the higher the price people will be willing to pay for it.
The US government also played a role. Fearing future problems with Social Security, the government created investment programs such as 401(k) savings plans and Roth IRAs, which gave average Americans an incentive not only to invest in the markets but to remain invested, even when times got tough. Continued stock buying, as a result of steady inflows from retirement savings vehicles and sharp penalties for selling, played a major role in the stock market’s late twentieth-century ascent.
Both demographics and government incentives led to increased demand, which pushed P/E ratios higher during the 1980s and 1990s, but another important (albeit less quantifiable) reason stocks rose to unprecedented heights had to do with the burning desire of investors. Behavior and preferences, if strong enough, can heavily influence demand and ultimately, price.
The late-1990s represented a period in which fundamental truths—the ideas that investors had relied on for decades to help them make decisions—were being pitched out the window. For a time, it really didn’t seem to matter whether a company was actually profitable or not, or if it was priced fairly relative to earnings. But ultimately the fundamentals won out. From the stratospheric P/E multiples that peaked during the tech bubble at all-time highs, the stock market posted a negative total return for the next decade—a very rare event.
We can learn a lot from the tech bubble, its bursting and ultimately the poor returns that followed. Professional investors fell prey to behavioral errors as they discarded tried and true fundamentals believing that in the new economy the only thing that mattered was growth potential. Many hard lessons were learned. Fundamentals matter, especially fundamentals such as the price of an investment relative to its value can provide great insight into future performance.
There is a powerful connection between the prevailing P/E multiple and subsequent long-term returns that follow thereafter. It is, in fact, a better predictor of future returns than just about anything else we might scrutinize. Vanguard produced an interesting study2 that looked at the proportion of the variance of future real stock returns that was explained by a variety of different metrics. In other words, they explored to what extent the current value of a particular metric explained the variability of future stock market performance. The study looked at a variety of things that people commonly consider when projecting future returns, such as valuation ratios, dividend yield, earnings growth, and economic factors including GDP growth trend, government debt-to-GDP, and corporate profits.
What they found, as illustrated in Fig. 1.3, is that the P/E 10, or the price to trailing ten-year earnings ratio, explained 43 percent of the variability of future stock market variability, better than any of the others. The P/E 10 is also known as the Shiller P/E ratio named for its creator Robert Shiller, or the cyclically adjusted P/E ratio (CAPE). Though not perfect, the study showed that the CAPE ratio has potential as a predictive tool. Notice also that Vanguard dropped in rainfall as one of the potentially predictive metrics. Although obviously not a viable stock market predicting tool, rainfall showed more explanatory power than some of the commonly used ones.
Fig. 1.3
Proportion of Variance of Future Real Stock Returns, 1926–2011. Data source: Vanguard
Figure 1.4 is another powerful visual supporting the long-term viability of the CAPE ratio. The data shows the inverse of the CAPE ratio, or earnings yield, which in this case is the ten-year normalized earnings divided by price versus the subsequent ten-year total return on the S&P 500. Notice not only the correlation between the lines but how low the earnings yield was as of April 2018. At just 3.1 percent, the earnings yield was lower than just 5 percent of all readings since the beginning of 1928. Similar lows were followed by a decade where the S&P 500 failed to produce a positive absolute return.
Fig. 1.4
Earnings Yield vs. Subsequent Stock Market Return. Data source: Robert Shiller, Stock Market Data Used in Irrational Exuberance, Princeton University Press, updated 2000, 2005, 2015
The next graph, Fig. 1.5, details historical data of valuations from 1881 to the end of 2017. In April 2018, the S&P 500’s price was 31.2 times trailing ten-year normalized earnings. That placed it in the top 96th percentile of all readings back to the late 1800s, which was almost exactly on par with the peak preceding the stock market crash of 1929, well above pre-2008 levels, and was bested only by the stratospheric heights reached during the tech bubble.
Fig. 1.5
CAPE January 1881—April 2018. Data source: Robert Shiller, Stock Market Data Used in Irrational Exuberance, Princeton University Press, updated 2000, 2005, 2015
So valuations as measured by CAPE suggest that the ten-year return for the S&P 500 Index following 2018 could be challenged. It is worth mentioning here that reasonable criticisms of the CAPE have been levied. In a 2016 paper titled “The Shiller CAPE Ratio: A New Look” published in the May/June Financial Analyst Journal, Jeremy Siegel wrote about the impact of accounting changes on earnings, specifically mark to market rules, and the differences between the use of operating and as-reported earnings in the denominator of a P/E ratio. CAPE uses reported earnings in its calculation methodology. According to Siegel, operating is more appropriate and if used in place of reported, the ratio would not be as high and predictions of future returns would not be as dire. Although a reduction is seen if operating earnings is substituted for reported, the drop in the CAPE is not terribly dramatic falling from 32.1 times to 28.2 times (end of 2017), a reading still well above the long-term average around 15 times.3
Another common criticism of CAPE is that part of its history is overstated given the catastrophic plunge in earnings during the global financial crisis (GFC). As of the end of 2017, the ten-year trailing earnings average used in the CAPE’s denominator still included the GFC’s earnings collapse and without it, the CAPE reading would not have been so high and again, less pessimistic of future stock market returns. But even if that recession had not happened and earnings remained elevated throughout, the CAPE ratio would have only been reduced to 29.8 times relative to its actual reading of 32.1 times at the end of 2017.4
Seigel’s 2016 paper also includes the following statistic (updated through 2017):5 In 426 of the 432 months from 1981 through 2017 (98.6 percent of the time), the actual ten-year real ...