Take control of your investment decisions
The investment industry is in a state of inertia. Recent events highlight an overreliance on mathematical foundations and flawed investment models. Investors need to find new paths to effective wealth creation.
The Empowered Investor provides a proven framework for wealth creation. Built around 7 key principles and practical real-world examples, the book provides insight into the limitations of traditional investment concepts, and illustrates how investors can take control of their investments. Instead of relying on often flawed financial advice, investors need to develop their own investment approach, drawing on their unique skill sets and experiences.
This book:
-Presents a practical strategy for wealth creation, based on practical experience and sound theoretical foundation;
-Provides real world cases and excerpts from interviews with highly successful investors;
-Demonstrates how investors can build on their core strengths, exploit opportunities and differentiate their investments;
-Illustrates how to protect a portfolio from threats and risks
This book will help you:
-Build on your core strengths;
-Identify and make the most of new opportunities;
-Cultivate quality networks;
-Differentiate your investments;
-Protect yourself against threats and risks;
-Understand and manage the time dimension;
-Execute with efficiency.
Written in a practical and straightforward manner, The Empowered Investor provides a robust strategic toolkit for investors, bringing the individual to the core of the investment strategy and creating new opportunities for wealth creation.
eBook - ePub
The Empowered Investor
7 Principles for Strategic Wealth Creation in a New Financial World
- English
- ePUB (mobile friendly)
- Available on iOS & Android
eBook - ePub
The Empowered Investor
7 Principles for Strategic Wealth Creation in a New Financial World
About this book
Trusted by 375,005 students
Access to over 1.5 million titles for a fair monthly price.
Study more efficiently using our study tools.
Information
Part I
FROM BROKEN INVESTMENT MODELS TO SUSTAINABLE STRATEGIC INVESTING
Chapter 1
PERILS OF THE MISGUIDED INVESTOR: LESSONS FROM A CFO – PART 1
Martin Heller began his career as a certified public accountant in the late 1970s. A highly qualified young man, he spoke several languages and soon established himself as a successful professional in the financial services industry. He married, had three children, bought a roomy family home, and as his income grew he was able to pay off his mortgage and save a fair amount.
In 1990, with a small inheritance along with his savings, Martin began to search for a way to invest his money. Lacking investment expertise, he sought advice from other professionals including his banker and business club friends who were also active in finance. He recalled, “Everybody suggested that I put my money in stocks and bonds, either buying them directly or by investing in mutual funds.” As a result he followed his banker’s suggestion and invested in a portfolio of quoted stocks and bonds. By 1998, his net wealth had fallen by 25 percent, not only as a result of that year’s crash but also due to high brokerage fees and taxes.
During our interview Martin concluded that “banks and their relationship managers have a significant conflict of interest with their clients. To maximize profits, the bank has to generate large brokerage fees and other revenues, which is in conflict with the interest of the client, who wants a portfolio that optimizes risk-adjusted returns with minimal transaction costs. The problem is that, even for a very client-oriented bank employee, the interests of the bank prevail because salaries and bonuses are tied to the revenues employees generate.”
When his banker saw that Martin was disappointed with the investment approach, he attempted to propose other investments based on the so-called scientific models such as the Modern Portfolio Theory. But Martin felt unable to assess these options, and he soon became dissatisfied with the hefty fees he was paying: “I had the impression that my banker always wanted to keep the initiative on his side, that he wanted to prevent me from taking responsibility for my own investment decisions.”
After discussions with friends who had similar experiences, Martin concluded that achieving satisfactory returns with his banker, perhaps with any banker, was highly unlikely. But he remained committed to building his personal wealth and achieving an annual return of at least 10 percent on his investments. He knew that he had to radically change his investment approach to achieve this goal.
Chapter 2
WHY TRADITIONAL INVESTMENT MODELS DON’T WORK
As long as Martin was investing according to his banker’s recommendations he was not able to substantially grow his wealth. Bonds generated only low returns, and he still had to pay taxes on the returns. His stocks went up and down with the market without any reasonable logic. “I realized that with the conventional approach to investing in (quoted) stocks and bonds I would never be able to build real wealth,” he confided in our interview. Why then does the financial industry heavily promote investments in these asset classes?
THE TRUTH ABOUT RETURNS ON STOCKS AND BONDS
When Martin’s advisors were convincing him to invest in stocks, they used graphs of S&P 500 returns from 1980–2000 which showed an impressive average return of 15 percent. However, if we look over the last 100 years (see Figure 2.1), the annualized S&P 500 return is a fraction of that, at just 2.10 percent.
Figure 2.1 Stock prices as measured by S&P 500, 1913–2013
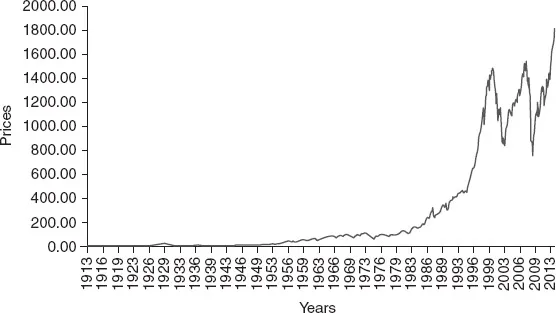
Source: S&P Capital IQ – capitaliq.com, S&P Historical Price.
True, with very good market timing – buying in September 2011 and selling in September 2012 – the annualized S&P 500 return would have been 24.83 percent.
Figure 2.2 Stock prices as measured by S&P 500, 2011–2012
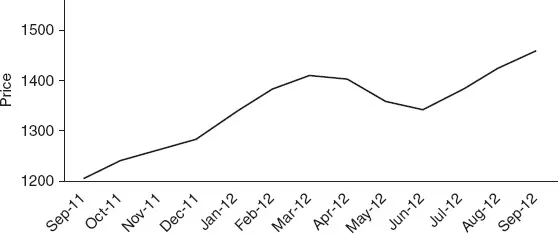
Source: S&P Capital IQ – capitaliq.com, S&P Historical Price.
But there is of course the other side of market timing: over the ten-year period from 2002 to 2012, an investor would have lost –0.35 percent.
Figure 2.3 Stock prices as measured by S&P 500, 2002–2012
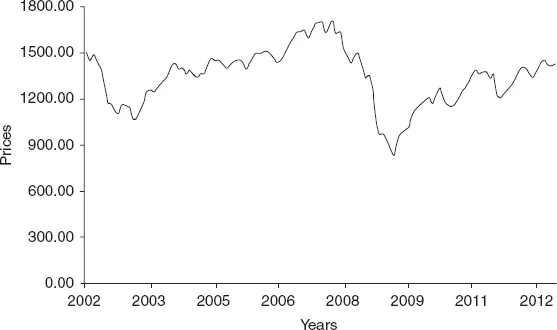
Source: S&P Capital IQ – capitaliq.com, S&P Historical Prices
Figure 2.3 illustrates that, to create wealth, an investor would have to apply a very difficult market timing. He would have had to invest massively in 2002, stay invested until 2007, sell all stocks in 2007, and again invest heavily in 2008 after the crash. Unfortunately, however, there is a fundamental difficulty in understanding market movements, even in retrospect. As the acclaimed economists George Akerlof and Robert Shiller1 explain:
The real value of the U.S. stock market rose over fivefold between 1920 and 1929. It then came all the way back down between 1929 and 1932. The real value of the stock market doubled between 1954 and 1973. Then the market came all the way back down. It then lost half of its real value between 1973 and 1974. The real value of the stock market rose almost eightfold between 1982 and 2000. Then it lost half of its value between 2000 and 2008. The question is not just how to forecast these events before they occur. The problem is deeper than that. No one can even explain why these events rationally ought to have happened even after they have happened. One might think, from the self-assurance that economists often display when extolling the efficiency of the markets, that they have reliable explanations of what has driven aggregate stock markets, which they are just keeping to themselves. They can of course give examples that justify the stock price changes of some individual firms. But they cannot do this for the aggregate stock market. Over the years economists have tried to give a convincing explanation for aggregate stock price movements in terms of economic fundamentals. But no one has ever succeeded. (Akerlof and Shiller, 2009, p. 131)
A similar comparison can be made for investments in stocks in countries other than the United States, with similar conclusions.
For bond investments the picture is even bleaker. Credit Suisse researchers Dimson, Marsh, Staunton, McGinnie, and Wilmot2 calculate the returns for bonds, before taxes and fees, for the period from 1900 to 2013.
Table 2.1 Bond real returns (1900–2013)
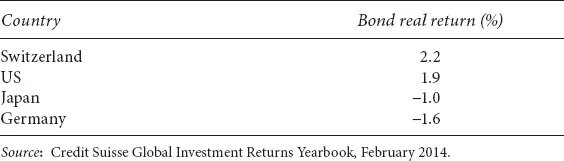
Table 2.1 illustrates that investing in bonds generates only limited real value. In countries such as Germany and Japan, where wars and financial crises (hyperinflation, failure of sovereign debt, etc.) transpired, significant value was destroyed.
In the above examples, we use indices as a basis for our consideration. But is it possible to achieve better results and beat these indices by investing in active managers? What are the chances of succeeding? A review by Cuthbertson, Nitzsche, and O’Sullivan3 examined the performance of mutual funds by analyzing more than 50 studies that were published by the US and the UK between 1990 and 2010, and they report the following:
Ex post, there are around 0–5% of top performing UK and US equity mutual funds with truly positive alpha performance (after fees) and around 20% of funds that have truly poor alpha performance with about 75% of active funds which are effectively zero alpha funds. Key driver of relative performance are load fees, expenses and turnover. (Cuthbertson, Nitzsche, and O’Sullivan, 2010, p. 91)
In other words, positive alpha which indicates that the returns are higher than a benchmark are rarely achieved in the mutual fund industry.
Fernandez and Del Campo4 offer an even more radical example demonstrating that from 1999–2009 only 16 of the 1,117 available mutual funds in Spain (1.4 percent), with a variety of different strategies for investing in shares or bonds, generated returns above the ten-year state bond. The average return was below inflation, and only four had returns above 10 percent, with 263 showing negative returns.
TAXES, FEES, AND OTHER COSTS
In evaluating investment performance one might easily get caught up in stocks and bonds returns data, but these data alone do not tell the full story. Investors should look carefully at total returns, and real inflation-adjusted returns. A study by Thornburg Investment Management5 calculates returns adjusted for inflation, taxes, and investment expenses – the “real” returns. The study illustrates that in the period between 1982 and 2012, the nominal return of the S&P 500 index was 10.80 percent, but after adjusting for expenses, taxes, and inflation the final return was a mere 5.79 percent (see Figure 2.4).
Figure 2.4 Nominal vs. real returns
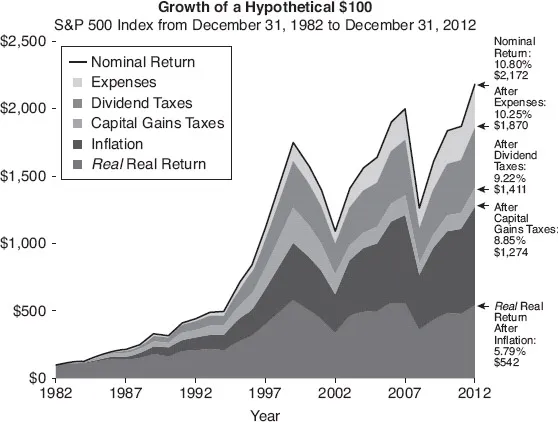
Source: Thornburg Investment Management 2013.
THE TEMPTATION TO FOLLOW SIMPLE GRAPHS AND THE CATASTROPHIC EFFECTS OF POWER LAWS
Besides the weak returns of stocks and bonds, another important factor contributing to poor portfolio performance is that the models applied by most academicians and financial experts do not give a true picture of expected performance due to simplified models and the application of the standard deviation as a basis for returns expectation. In their popular finance textbook, Corporate Finance, Ross, Westerfield, and Jaffe6 explain that with a large enough sample of stock market returns and a long enough observation period (about 1,000 years), distribution of returns would form a “Normal” bell-shaped curve as shown in Figure 2.5.
Figure 2.5 The Normal Distribution
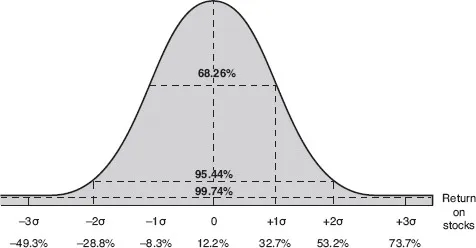
Source: Ross Stephan, Westerfield Randolph and Jaffe Jeffrey, 2010 Corporate Finance, 247–249.
This would be excellent news since Brealey and Myers7 point out that “Normal Distributions can be completely defined by two numbers: one is the average or expected return (the historic mean of observed returns) and the other is the variance or standard deviation. They are the only two measures that an investor needs to consider.”
However, looking at the Normal Distribution of Figure 2.5, a hypothetical investment portfolio with a historic average return of 12.2 percent could with a probability of 68.26 percent generate an investment return between –8.3 and 32.7 percent! Returns based on this commonly used “Normal Distribution” would sometimes be positive and sometimes negative across a broad performance range.
The key mathematical concept of what constitutes a Normal Distribution was developed by Carl Friedrich Gauss, considered one of the seminal mathematicians of the nineteenth century. Not surprisingly, quantitative economists of the first half of the twentieth century were keen to use Gauss’s concepts to construct models for optimal portfolio construction, particularly because of its simplicity, which led to the Capital Asset Pricing Model (CAPM), optimizing return and risk, and the Modern Portfolio Theory (MPT). As these mathematical models gained wider industry acceptance, they evolved into a marketing tool for advisors who claimed that their advice was based on the work by Nobel prize-winning academic researchers. Until today, many financial institutions use this classic concept of risk management, standard deviation, and other measurements, based on the Normal Distribution.8
SO IS INVESTING A BELL CURVE GAME?
The question is whether stock market returns follow a Normal Distribution. Research conducted in the late 1990s and early 2000s suggest that the hypothesis of Normal Distribution does not conform to many events in the financial markets. Marcus Dav...
Table of contents
- Cover
- Title
- Part I From Broken Investment Models to Sustainable Strategic Investing
- Part II How to Be a Successful Strategic Investor
- Appendices
- Notes
- References
Frequently asked questions
Yes, you can cancel anytime from the Subscription tab in your account settings on the Perlego website. Your subscription will stay active until the end of your current billing period. Learn how to cancel your subscription
No, books cannot be downloaded as external files, such as PDFs, for use outside of Perlego. However, you can download books within the Perlego app for offline reading on mobile or tablet. Learn how to download books offline
Perlego offers two plans: Essential and Complete
- Essential is ideal for learners and professionals who enjoy exploring a wide range of subjects. Access the Essential Library with 800,000+ trusted titles and best-sellers across business, personal growth, and the humanities. Includes unlimited reading time and Standard Read Aloud voice.
- Complete: Perfect for advanced learners and researchers needing full, unrestricted access. Unlock 1.5M+ books across hundreds of subjects, including academic and specialized titles. The Complete Plan also includes advanced features like Premium Read Aloud and Research Assistant.
We are an online textbook subscription service, where you can get access to an entire online library for less than the price of a single book per month. With over 1.5 million books across 990+ topics, we’ve got you covered! Learn about our mission
Look out for the read-aloud symbol on your next book to see if you can listen to it. The read-aloud tool reads text aloud for you, highlighting the text as it is being read. You can pause it, speed it up and slow it down. Learn more about Read Aloud
Yes! You can use the Perlego app on both iOS and Android devices to read anytime, anywhere — even offline. Perfect for commutes or when you’re on the go.
Please note we cannot support devices running on iOS 13 and Android 7 or earlier. Learn more about using the app
Please note we cannot support devices running on iOS 13 and Android 7 or earlier. Learn more about using the app
Yes, you can access The Empowered Investor by C. Puempin,H. von Liechtenstein,F. Hashemi,Kenneth A. Loparo,Heinrich von Liechtenstein in PDF and/or ePUB format, as well as other popular books in Business & Accounting. We have over 1.5 million books available in our catalogue for you to explore.