eBook - ePub
Emerging Powers in the WTO
Developing Countries and Trade in the 21st Century
- English
- ePUB (mobile friendly)
- Available on iOS & Android
eBook - ePub
About this book
This volume examines the main factors for developing country trade performance in the last thirty years, their own trade policies, market access issues they face, and their increasingly more effective participation in the WTO and the Doha Round of multilateral trade negotiations.
Trusted by 375,005 students
Access to over 1.5 million titles for a fair monthly price.
Study more efficiently using our study tools.
Information
1
Trends in the Trade of Developing Countries, 1980–2010
Introduction
The period covered by this study, 1980–2012, witnessed a rapid expansion of world trade and an even more rapid expansion of developing countries’ trade, especially in the last decade (see Appendix A for a description of developing country and group coverage). The share of trade in developing countries in total world merchandise trade (exports plus imports) was appreciably higher at the end of the period than at the beginning: 27 per cent as opposed to 39 per cent (see Tables 1.1 and 1.2). There was a sharp decline in world trade in 2009, though this was offset by an even larger increase in 2010. Trade growth has decelerated in 2011–12, with exports growing at about 2 per cent in 2012 compared with 5 per cent in 2011; and there are many uncertainties about 2013. Yet, this does not affect these broad overall trends.
A similar picture emerges if one also considers trade in services. While the data on services are much less complete than for merchandise trade, there is little doubt about the overall trends: services trade grew even faster than merchandise trade; and there was a rise in the share of developing countries’ exports. As a consequence of these trends the role developing countries play in the international trading system has changed radically; and this has been reflected in their participation in the moribund Doha Development Round negotiations.
GDP growth during this period was much less than the growth in trade for developed and developing countries alike. Using the ratio of total trade to GDP as an indicator of integration into world trade, on average developing countries were more integrated at the end of 2010 than 20 years earlier. This was the result of another long-term trend in evidence over the past 50 years and an important dimension of the globalization process.
Table 1.1 World merchandise exports by country group and region, 1980–2010
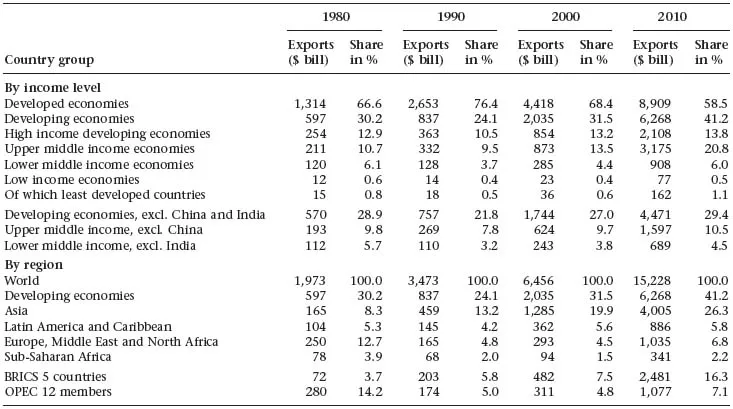
Source: UN COMTRADE database.
Table 1.2 World merchandise imports by country group and region, 1980–2010
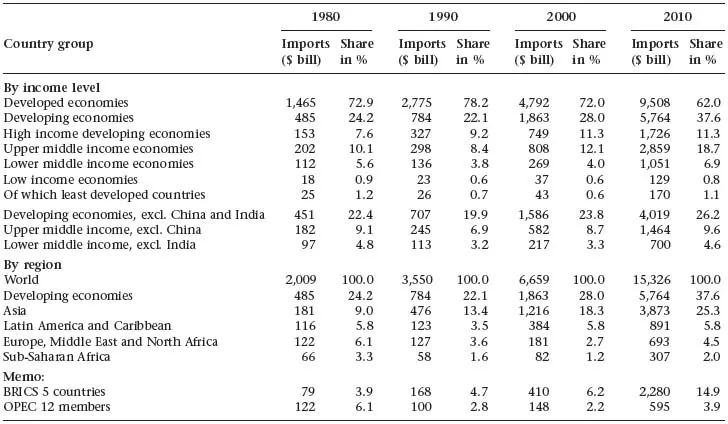
Source: UN COMTRADE database.
These overall trends, however, disguise very different patterns during some of the sub-periods and among different developing countries and groups. Broadly speaking, the data show that, except for Asia, the 1980s were pretty much a ‘lost’ decade for many different developing countries and groups. By comparison, during the 1990s and 2000s trade for practically all major groupings of developing countries grew faster than trade of developed countries and, in many cases, very rapidly indeed. The Least Developed Countries (LDCs) deserve special mention: while growth in their merchandise trade was much slower than that of developing countries as a whole for the first 20 years (1980–2000) it was the most rapid during the decade 2001–10. As a result, for the first time in many decades these countries showed an increase in their small share of total world trade.
Trends in merchandise trade
The merchandise exports of developing countries grew at an annual rate of 8.2 per cent for the period 1980–2010 compared with 6.6 per cent for developed countries (see Table 1.). But the performance was very different in the 1980s compared with the 1990s and 2000s. In the 1980s, developing-country exports grew only at 3.4 per cent while exports of developed countries expanded at over 7 per cent per annum. This reflects in large part the slower growth of the world economy during this period as well as the debt problems encountered by many groups of developing countries, especially in Latin America and Africa.
In the last two decades the situation was reversed with the export growth of developing countries at more than 10 per cent per annum compared with about 6 per cent for the developed countries. The trends in merchandise imports parallel those in exports both for developed and developing countries alike. But in both periods, the developing countries’ imports grew faster than their exports. Table 1.3 also shows the performance of different regions and groupings of developing countries.
China’s exceptional trade performance throughout the period, and India’s in the last two decades, are well known. What is not always understood is that other groups of developing countries’ trade also grew very rapidly during the past 20 years, especially since 2000. Indeed, since the beginning of the 21st century, growth in the trade of all major developing country groupings, whether classified by income level or by region, was faster than that of developed countries. For the 30 years from 1980 to 2010, only the developing countries in sub-Saharan Africa and the group of developing countries in Europe, Middle and North Africa – whose exports are dominated by oil – experienced trade growth slower than that of developed countries. In practically all cases and periods, Asia as a region has shown the greatest growth, with Latin America second. But sub-Saharan Africa, Europe, the Middle East and North Africa grew fastest in the last decade.
Table 1.3 Growth in world merchandise trade by country group and region, 1980–2010
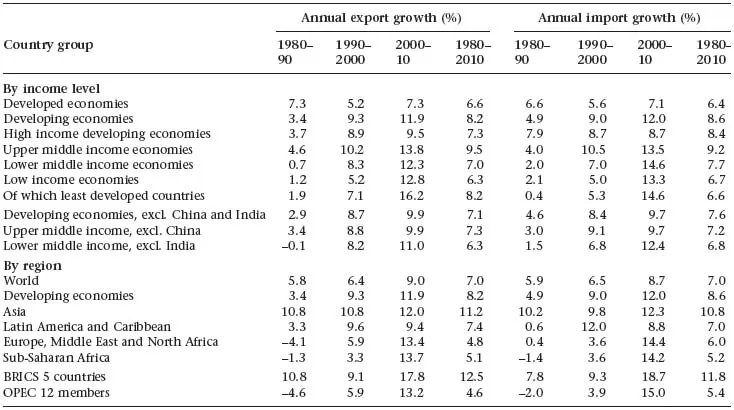
Source: UN COMTRADE database.
As noted in many studies, the trade performance of the various groups of developing countries depends very much on the composition of their exports as between manufactures, primary commodities and foodstuffs on the one hand and the direction of their trade on the other. Overall, the growth of developing countries’ manufacturing exports and imports has exceeded that of developed countries for practically all groupings of developing countries for the last two decades and for the period as a whole (see Table 1.4). The same holds true for non-manufacturing trade – except that in this case LDC exports of raw materials and minerals lagged behind those of developed countries in the 1990s. In the 2000s, however, increased demand and rising prices of raw materials led to a very rapid (14.6 per cent per annum) increase of LDC non-manufacturing trade.
In the 1980s and 1990s, with the exception of China, trade grew fastest for the higher and middle-income developing countries and more slowly for the lower income countries and the LDCs. This relationship, however, did not hold up in the 2000s when LDC exports expanded very rapidly, indeed more rapidly than any other group, except for the upper-middle income economies whose performance is dominated by China.
Within manufacturing, developing country export growth was especially rapid in machinery and transport as well as chemicals. Practically all developing country groups shared in this growth (see Table 1.5), which was especially rapid in the upper-middle income countries, even when excluding China, as well as Brazil, Russia, India, China and South Africa (the BRICS) and Latin America.
The growth of manufactured exports in the developing world was in part prompted by the development of value chains, which took advantage of labour-cost differentials. Developing countries benefited from large investments by both multinationals and local entrepreneurs in assembly or production of final consumer goods based on the importation of intermediates. It is difficult to estimate how much of this happened in different parts of the developing world. One proxy for intermediates is given by an indicator consisting of 75 parts and component products at the Standard International Trade Classification (SITC) two to five-digit level (for a list of parts and component products, see Michalopoulos and Ng, 2013a, Appendix B, Table 3).
Table 1.4 Growth in manufacturing and non-manufacturing trade by country group and region, 1980–2010
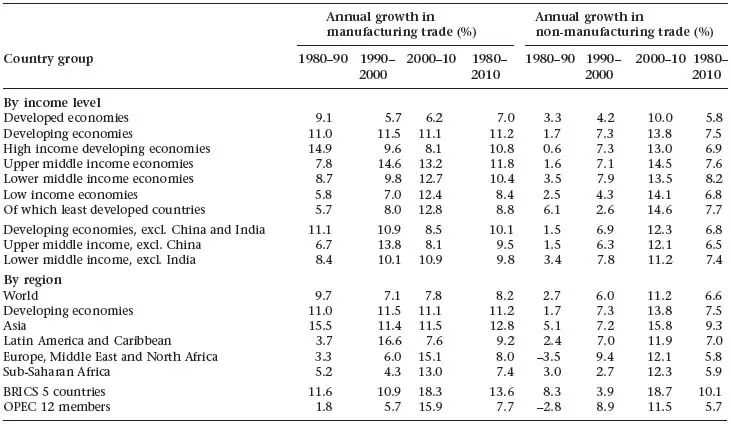
Note: The classification of manufacturing products in exports and imports is defined as SITC 5+6+7+ 8−68 in revision 3.
Source: UN COMTRADE database.
Source: UN COMTRADE database.
Table 1.5 Growth in sectoral exports by country group and region, 1980–2010 (annual average, %)
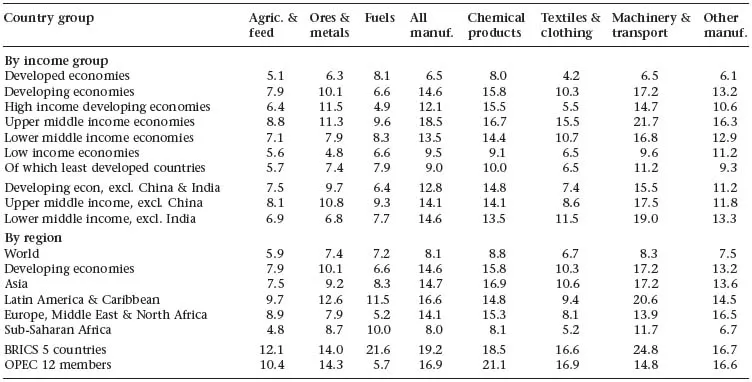
Notes: The classification of product groups is defined in SITC revision 2 as agriculture & feed (0+1+2+4–27–28), ores & metals (27+28+68), fuels (3), all manufactures (5+6+7+8–68), chemical products (5), textiles & clothing (26+65+84), machinery & transport (7) and other manufactures (6+8–65–68–84). Export data in sectoral breakdown are based on 161 countries available from the UN COMTRADE database. Where the aggregate merchandise export data is based on a total of 192 countries, data available in Table 3 from World Development indicators database.
Source: UN COMTRADE database.
Source: UN COMTRADE database.
Table 1.6 Growth and share of parts and components in manufacturing imports by country group and region, 1980–2010
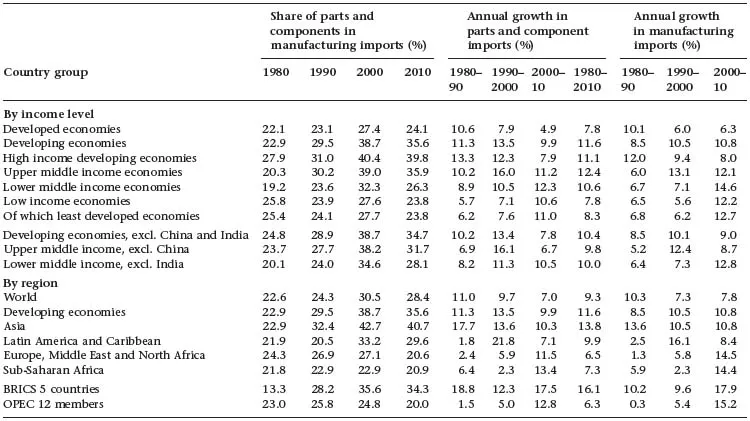
Note: The classification of parts and components items is based on 75 products at SITC 2 to 5-digit level in revision 2, including textiles & clothing (65+61), machinery & transport equipment (7), metal manufacturing (69), other miscellaneous manufactured goods (8). For details see Aminian et al., 2009.
Source: Based on UN COMTRADE statistics.
Source: Based on UN COMTRADE statistics.
In 1980 the share of parts and components in total manufacturing imports was only slightly higher in developed countries than in developing ones. In the next two decades this share grew in both groups of countries, but much faster in developing countries. The aggregate share of parts and components in total imports fell in both developed and developing countries in the decade 2001–10. At the end of 2010 the shares were higher the higher the developing-country income grouping.
But not all groups of developing countries followed this pattern over time: for example, low income economies and the least developed ones did not see an increase in the share of parts and components until the decade of the 1990s. Sub-Saharan Africa, Europe, the Middle East and North Africa as well as the LDCs actually had lower ratios of parts and components in their imports at the end of the 30 years than at the beginning. By contrast, the BRICS raised their share drastically – more than doubling in the decade of the 1980s – and maintained their growth, almost uninterruptedly until 2010. China increased its income sixfold from value chains between 1995 and 2009, India fivefold, Brazil threefold (OECD, WTO, UNCTAD, 2013). Lower-income economies, sub-Saharan Africa and the LDCs have benefited much less. They have failed to diversify and continued to specialize in the primary product phase of the supply chains.
A significant portion of the growth in developing countries’ exports of manufactures as well as of commodities is the result of expanding trade among the developing countries themselves. China’s growth has been instrumental in this but trade among developing countries has grown rapidly in other regions as well. Part of this growth may be the result of preferential regional arrangements, but part of it can be explained by the fact that during most of the 1990s and 2000s growth in incomes in most developing countries’ groupings outpaced that of developed countries. Table 1.7 shows that South–South trade grew faster than any other trade over the last 30 years. Indeed the share of this trade in total wo...
Table of contents
- Cover
- Title
- Copyright
- Contents
- List of Tables
- List of Abbreviations
- Preface and Acknowledgements
- Introduction: Developing Countries in World Trade
- 1 Trends in the Trade of Developing Countries, 1980–2010
- 2 Trade and Development in GATT and the WTO
- 3 WTO Accession Issues
- 4 Developing-Country Trade Policies
- 5 Developing-Country Trade-Related Institutions and Aid for Trade
- 6 Developed-Country Trade Policies
- 7 The TRIPS Agreement and Developing Countries
- 8 Developing-Country Participation in the WTO
- 9 The Doha Round Negotiations
- 10 The Future of the WTO in Global Governance
- 11 Conclusions and Recommendations
- Appendix A: Country Groupings
- Appendix B: Methodology in Estimating Frequency Ratios
- References
- Index
Frequently asked questions
Yes, you can cancel anytime from the Subscription tab in your account settings on the Perlego website. Your subscription will stay active until the end of your current billing period. Learn how to cancel your subscription
No, books cannot be downloaded as external files, such as PDFs, for use outside of Perlego. However, you can download books within the Perlego app for offline reading on mobile or tablet. Learn how to download books offline
Perlego offers two plans: Essential and Complete
- Essential is ideal for learners and professionals who enjoy exploring a wide range of subjects. Access the Essential Library with 800,000+ trusted titles and best-sellers across business, personal growth, and the humanities. Includes unlimited reading time and Standard Read Aloud voice.
- Complete: Perfect for advanced learners and researchers needing full, unrestricted access. Unlock 1.5M+ books across hundreds of subjects, including academic and specialized titles. The Complete Plan also includes advanced features like Premium Read Aloud and Research Assistant.
We are an online textbook subscription service, where you can get access to an entire online library for less than the price of a single book per month. With over 1.5 million books across 990+ topics, we’ve got you covered! Learn about our mission
Look out for the read-aloud symbol on your next book to see if you can listen to it. The read-aloud tool reads text aloud for you, highlighting the text as it is being read. You can pause it, speed it up and slow it down. Learn more about Read Aloud
Yes! You can use the Perlego app on both iOS and Android devices to read anytime, anywhere — even offline. Perfect for commutes or when you’re on the go.
Please note we cannot support devices running on iOS 13 and Android 7 or earlier. Learn more about using the app
Please note we cannot support devices running on iOS 13 and Android 7 or earlier. Learn more about using the app
Yes, you can access Emerging Powers in the WTO by C. Michalopoulos in PDF and/or ePUB format, as well as other popular books in Economics & International Business. We have over 1.5 million books available in our catalogue for you to explore.