eBook - ePub
More than Revenue
Taxation as a Development Tool
- English
- ePUB (mobile friendly)
- Available on iOS & Android
eBook - ePub
More than Revenue
Taxation as a Development Tool
About this book
This exciting new volume provides an up-to-date overview of the current state of taxation in the Latin America and Caribbean (LAC) region, its main reform needs, and possible reform strategies that take into account the likely economic, institutional, and political constraints on the reform process.
Trusted by 375,005 students
Access to over 1.5 million titles for a fair monthly price.
Study more efficiently using our study tools.
Information
Part I
The Tax Forest
1
Undressing the Myths
The structure of taxation in Latin American and Caribbean countries is usually described as suffering from four major shortcomings: collection is very low, taxes are barely progressive, tax evasion is rampant, and tax administrations are very weak.1 These characteristics create a self-reinforcing vicious circle, whose deep historical roots can be found in the distribution of wealth and effective political rights in the region.2 One of the rent-seeking mechanisms that the most affluent have imposed on the rest of society is the regressive design of the tax structure. Opportunities to evade taxes that vary greatly across income groups compound this perverse structure, shrinking the effective tax bases and resulting in low levels of revenue.3
This description is not very encouraging, but fortunately it does not do justice to the current state of taxation in Latin America and the Caribbean. Although these characteristics are valid as stylized facts, they do not apply equally to all countries and are becoming less accurate in light of recent developments in taxation. While they may once have been good descriptions of reality, they are now approaching myths.
The Myth and Reality of Low Taxation
It is often claimed that Latin American and Caribbean governments collect little tax revenue. This claim is immediately associated with problems such as the concentration of income and the public sector’s incapacity to respond to the demand for social spending and public goods of all types, from transportation infrastructure to citizen security. But like all often-repeated claims, this claim obscures a much more complex reality.
True, the tax burden (taking into account all taxes, but not social security contributions and other fiscal revenues) in Latin America is low compared with other regions. In Latin America, national and subnational governments collect 17.5 percent of GDP in taxes (figure 1.1). Tax revenue is higher in Eastern European countries (24.1 percent of GDP) and the 32-member countries of the Organisation for Economic Co-operation and Development (OECD) outside of Latin America (25.4 percent). This group will be considered representative of developed countries for purposes of this analysis.4
Figure 1.1 Tax Burden as Percentage of GDP, 2008–10 (simple average)
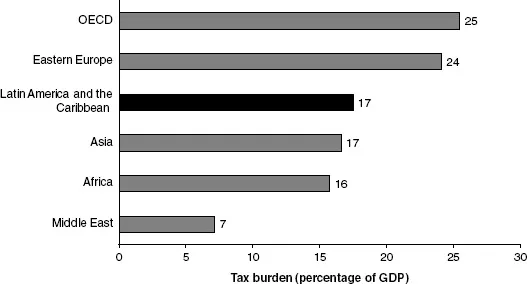
Note: The tax burden does not include social security contributions. Africa does not include Angola, Malta, Lesotho, and Swaziland. OECD is the Organisation for Economic Co-operation and Development.
Source: Authors’ estimates based on IDB and CIAT (2012) and IMF (2011b).
The richer countries generally tend to collect a higher proportion of GDP in tax revenues. Thus, it is not entirely surprising that tax receipts in Latin America and the Caribbean are higher than in Africa and lower than in the OECD. However, taken individually, most Latin American countries collect less tax revenue than might be expected for their income levels. For example, Guatemala, Mexico, Panama, and Trinidad and Tobago have tax burdens close to 10 percent of GDP, well below the typical burdens of other countries with similar income levels. According to the criterion of per capita income level, the tax collection gap is 7 points of GDP for Guatemala and 11.5 percentage points of GDP for Mexico. On average, the 23 Latin American and Caribbean countries considered have a collection gap of about 2 percentage points of GDP (figure 1.2).5
The fact that higher-income countries have higher tax burdens is due, above all, to income tax. Globally, very few low-income countries raise more than 3 percent or 4 percent of GDP through taxes on personal income and businesses. By contrast, the government of a high-income country usually garners the equivalent of more than 15 percent of GDP from these sources. But the richest Latin American societies enjoy fairly modest income tax burdens. Argentina, Costa Rica, and Uruguay—relatively wealthy and egalitarian societies by the standards of the region—have large income tax deficits (more than 4.5 percentage points of GDP, according to the per capita income criterion). Even Brazil, which has a burden of taxes and social security contributions comparable to that of the OECD countries, has an income tax deficit (figure 1.3).6
Figure 1.2 Tax Burden Gap, 2007–09 (percentage points of GDP)
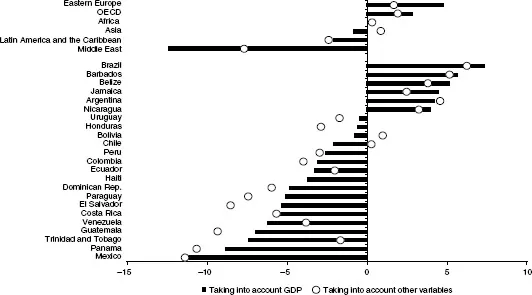
Notes: The “gap” is the excess or deficit in tax collection with respect to international patterns, based on GDP and “other variables”: the proportion of the population under 15 years of age and over 65, percentage of the labor force that is self-employed, coefficient of exports and imports with respect to GDP, and coefficient of rents from natural resources with respect to GDP. OECD is the Organisation for Economic Co-operation and Development.
Source: Authors’ calculation based on IDB and CIAT (2012) and IMF (2011b).
This low tax effort is not exclusive to central governments. Since the 1980s, Latin America has undergone a rapid process of political and fiscal decentralization, which should have helped raise the tax revenue of subnational governments.7 However, as discussed in chapter 5, with the notable exceptions of Argentina and Brazil (whose subnational governments collect 5.9 percent and 9.8 percent of GDP, respectively),8 subnational taxation is very modest. Even countries that have made relatively rapid progress in decentralizing expenditure, such as Colombia (where subnational governments obtain only 2.9 percent of GDP from their own taxes), fare poorly. Excluding Argentina and Brazil, the tax burden of subnational governments averages only 0.8 percent of GDP, confirming the assertion that Latin American countries collect very little tax revenue.
Figure 1.3 Income Tax Gap, 2007–09
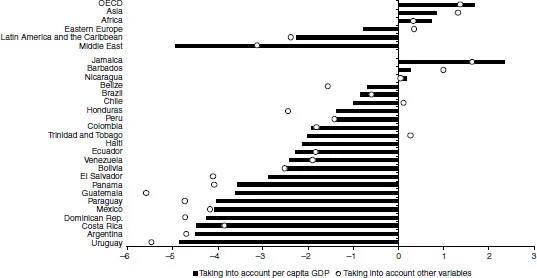
Notes: The “gap” is the excess or deficit in collection with respect to international patterns, based on GDP and “other variables”: the proportion of the population under 15 years of age and over 65, percentage of the labor force that is self-employed, coefficient of exports and imports with respect to GDP, and coefficient of rents from natural resources with respect to GDP. OECD is the Organisation for Economic Co-operation and Development.
Source: Authors’ calculation based on IDB and CIAT (2012) and IMF (2011b).
One defense of the paltry collections posits that Latin American countries have less need to raise taxes because they have abundant natural resources that can provide tax revenue. Alternatively, low tax receipts may reflect not so much the availability of other sources of revenue as the relatively high importance of “hard-to-tax” activities, such as small businesses. Although these arguments are valid (as shown by the econometric analysis on which figures 1.2 and 1.3 are based),9 they explain relatively little: the tax gaps (in total or income tax) do not disappear when they are calculated to include these criteria, and in some cases are even higher than when the calculation is based only on the per capita income level.
Thus, it is true that tax collection is low relative to the per capita income levels of countries, even after taking into account various characteristics of the economic structure that may affect taxation. However, this stylized fact can obscure very important distinctive features of taxation in Latin America and the Caribbean and risk disregarding some potentially far-reaching changes. First, the tax burden has increased more in Latin American and Caribbean countries than anywhere else in the world: by 2.7 points of GDP from the early 1990s to the second half of the 2000s (figure 1.4). Two decades ago only Middle Eastern countries had lower tax burdens than Latin American countries. Today taxpayers in Latin America and the Caribbean pay more taxes (as a proportion of income) than they do in Asian or African countries.
Figure 1.4 Tax Burden by Region, 1990 and 2010 (simple average, percentage of GDP)
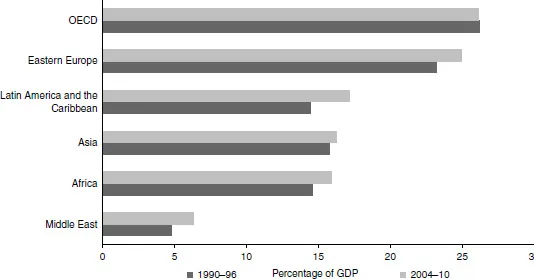
Notes: Africa does not include Angola, Malta, Lesotho, and Swaziland. The tax burden does not include social security contributions. There are no data for Eastern Europe for the period 1990–96. OECD is the Organisation for Economic Co-operation and Development. The 1990–96 data for Eastern Europe correspond to the 1997–2003 period.
Sources: Authors’ estimates based on IDB and CIAT (2012) and IMF (2011b).
Second, the significant increase in the tax burden is not a phenomenon limited to just a few countries in the region. The tax burden has grown in almost all Latin American and Caribbean countries, whether relatively rich economies, such as Argentina, Chile, and Uruguay; or lower-income countries, such as Guatemala and Bolivia; in countries rich in oil and minerals, such as Colombia, Ecuador, and Peru; in economies with fewer natural resources, such as the Dominican Republic and El Salvador; or in tourism-dependent countries, such as Barbados; as well as in those dependent on external transfers, such as Nicaragua. The tax burdens fell in only three countries (Mexico, Trinidad and Tobago, and Venezuela)— all oil exporters—in the three-year periods from 1991 to 1993 and 2008 to 2010 (figure 1.5).
Figure 1.5 Changes in the Tax Burden since the Early 1990s
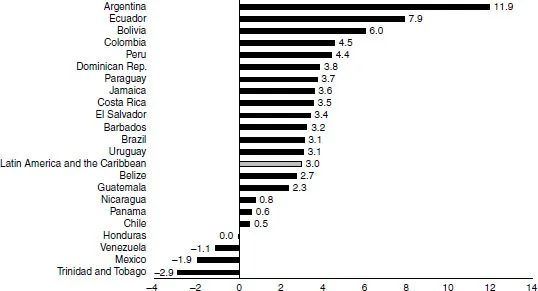
Note: The tax burden does not include social security contributions. The data correspond to (average tax burden 2008–10) – (average tax burden 1991–93). For those countries without data for the 1991–93 period, data from 1994 or 1995 was used.
Source: Authors’ calculations based on IDB and CIAT (2012) and IMF (2011b).
Third, tax increases have taken place across all tax sources, with the exception of taxes on international trade and excise duties (figure 1.6). The value added tax (VAT) has become the main source of tax revenue in Latin America and the Caribbean, with receipts now reaching 6.3 percent of GDP. VAT tax burdens on average hover already at levels similar to those of developed countries. In Brazil and Uruguay, they sit far above world standards, and in seven other Latin American countries, they surpass the world standard (figure 1.7).
Apart from VAT, revenue from other taxes has grown significantly. Corporate income tax currently generates 3.4 percent of GDP in the region, substantially more than the 1.9 percent of GDP raised in the early 1990s (figure 1.6). However, part of this increase is due to higher taxation of the agricultural and mining sectors, thanks to the recent boom in foreign prices. Even the tax burden of individuals, although still very low by world standards, has grown modestly: from 1.6 percent of GDP in the first half of the 1990s to 2 percent in the second half of the 2000s.
Figure 1.6 Structure of Fiscal Revenue in Latin America and the Caribbean, 1990–2010
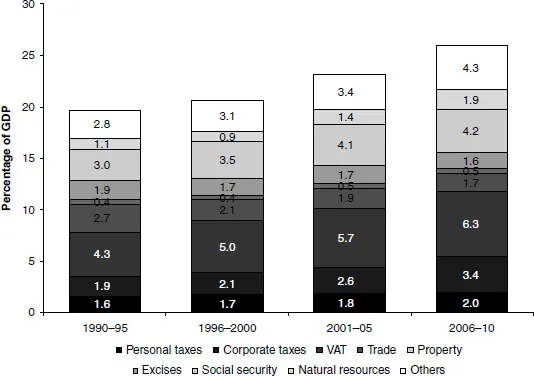
Note: The data correspond to the simple average of 21 countries in the region.
Source: IDB and CIAT (2012).
Figure 1.7 The VAT Burden, Select Latin American Countries
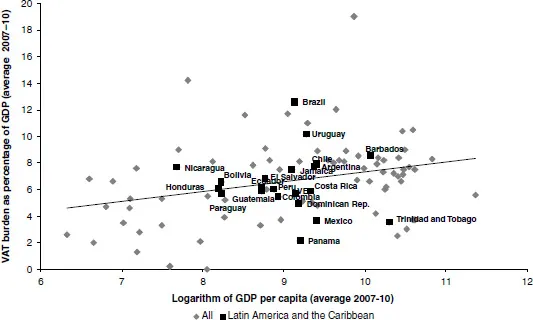
Source: Authors’ calculations based on IDB and CIAT (2012) and IMF (2011b).
Fourth, the tax burden considered so far is only part of the fiscal burden, which also encompasses social security contributions and nontax fiscal revenue, including that derived from exploitation of natural resources (mainly...
Table of contents
- Cover
- Title Page
- Copyright
- Contents
- List of Boxes
- List of Figures
- List of Tables
- Acknowledgments
- About the Contributors
- Preface
- Part I The Tax Forest
- Part II The Trees: Tax by Tax
- Part III Harvesting for Development
- Notes
- References
- Index
Frequently asked questions
Yes, you can cancel anytime from the Subscription tab in your account settings on the Perlego website. Your subscription will stay active until the end of your current billing period. Learn how to cancel your subscription
No, books cannot be downloaded as external files, such as PDFs, for use outside of Perlego. However, you can download books within the Perlego app for offline reading on mobile or tablet. Learn how to download books offline
Perlego offers two plans: Essential and Complete
- Essential is ideal for learners and professionals who enjoy exploring a wide range of subjects. Access the Essential Library with 800,000+ trusted titles and best-sellers across business, personal growth, and the humanities. Includes unlimited reading time and Standard Read Aloud voice.
- Complete: Perfect for advanced learners and researchers needing full, unrestricted access. Unlock 1.5M+ books across hundreds of subjects, including academic and specialized titles. The Complete Plan also includes advanced features like Premium Read Aloud and Research Assistant.
We are an online textbook subscription service, where you can get access to an entire online library for less than the price of a single book per month. With over 1.5 million books across 990+ topics, we’ve got you covered! Learn about our mission
Look out for the read-aloud symbol on your next book to see if you can listen to it. The read-aloud tool reads text aloud for you, highlighting the text as it is being read. You can pause it, speed it up and slow it down. Learn more about Read Aloud
Yes! You can use the Perlego app on both iOS and Android devices to read anytime, anywhere — even offline. Perfect for commutes or when you’re on the go.
Please note we cannot support devices running on iOS 13 and Android 7 or earlier. Learn more about using the app
Please note we cannot support devices running on iOS 13 and Android 7 or earlier. Learn more about using the app
Yes, you can access More than Revenue by Inter-American Development Bank,Ana Corbacho,Vicente Fretes Cibils,Eduardo Lora,Inter-American Development Bank in PDF and/or ePUB format, as well as other popular books in Business & Corporate Finance. We have over 1.5 million books available in our catalogue for you to explore.