To what extent is South Africa affected by G8 economies and BRIC growth shocks? This book identifies channels that amplify these shock effects, the relevance of third country transmission effects and the effects of the first and second rounds of US quantitative easing. The changing reactions of South African variables over time to financial shocks emanating from the US and selected countries in the Euro area, is presented. The book quantifies the effects of capital flow shocks, determines the counterfactuals of asset prices and economic growth variables, and compares the contribution of capital flows and domestic macro factors on asset prices. The effects of the exchange rate depreciation are contrasted to the decline in investment as key drivers of the trade balance. Stock market interdependence is determined amongst South African, Indian and Brazilian equities. The contributions of stock price returns and volatility on South African economic growth are contrasted. The authors construct a financial stress index for South Africa and determine how it amplifies shocks.

eBook - ePub
Global Growth and Financial Spillovers and the South African Macro-economy
- English
- ePUB (mobile friendly)
- Available on iOS & Android
eBook - ePub
Global Growth and Financial Spillovers and the South African Macro-economy
About this book
Trusted by 375,005 students
Access to over 1.5 million titles for a fair monthly price.
Study more efficiently using our study tools.
Information
1
Introduction
Since 2007, South African economic growth has weakened and become volatile following a sequence of unexpected global shocks. These began at the onset of the global financial crisis in 2007, continued with the subsequent global recession in 2008 and upon the onset of the euro area sovereign debt crisis and the implementation of unconventional monetary policies. The empirical assessment and quantification of the effects of these adverse shocks emanating from advanced economies is important for both policymakers and researchers. It is necessary for policymakers to understand the nature of these unexpected shocks and disentangle whether the spillover is directly and indirectly transmitted into the South African economy. The various channels have not been explored in detail, and it is the objective of this book to analyse these effects. Is the South African economy vulnerable to external shocks, and if so, in what way? How does the economy respond to these shocks, which manifest themselves as the unexpected changes in global economic growth, global risk perceptions and financial spillovers?
Part 1 of the book focuses on macroeconomic and financial issues related to growth spillover effects into South Africa, and on the channels of transmission of these shocks. The transmission mechanism of external shocks into South Africa may ends up having an impact on employment, the labour market dynamics could be inferred from well-established economic linkages, such as Okun’s law. This law states that an increase in economic growth should lower the unemployment rate. However, some government initiatives aimed at reducing the unemployment rate through increased government expenditure on expanded public-works programmes, can be hampered by developments in international markets.
Part 2 of this book, shows the external financial spill over in bond yields on South African borrowing costs. Thus, increased borrowing costs from international markets can have a negative impact on the South African government’s ability to raise funds to finance public-works programmes. This leads to a slowdown and, in severe cases, to the postponement of some of the employment-creating projects. Part 3 focuses on capital flows, and it notes that not all external shocks are bad, and some are beneficial. For example, a surge in capital inflows can lead to higher financial-asset prices and residential prices, thus leading to a positive wealth and collateral effects and to a stimulating effect on the property sector. Through various channels, these can contribute positively to employment creation.
How should readers expect to benefit from this book? Strategies for stimulating economic growth have been a big issue for South African policymakers and for our interest in investigating spillover effects and the channels that amplify growth shocks from G8 countries.1 The book also examines the sensitivity of South African growth to the major economies with the acronym BRIC, that is, Brazil, Russia, India and China. The transmission channels of external financial shocks into the South African economy are examined by analysing: (1) capital flows and their impact on equity and property prices; and (2) economic growth. Part 4 assesses the existence of the South African stock market’s correlation with Brazil and India. Interdependencies will indicate whether these associations tend to act as conduits of contagion effects across these markets. Largely informed by the experience from the recent global financial crisis and its impact on the transmission mechanism, we construct the financial stress index (FSI). Moreover, the prominence of the financial stability mandate for policymakers also compels us to assess the various channels through which the FSI transmits financial shocks into the macro economy.
Is South Africa vulnerable to external shocks, and if so, in which ways? As a precursor to the empirical analysis conducted in the book, we examine various ways in which the South African economy is exposed to unexpected external shocks, doing so by using simple statistical tools. In some instances we show both short- and long-term trends and signs of economic relationships. This is an introduction to a more rigorous econometric analysis in the book’s subsequent chapters.
1.1 Stylised facts
1.1.1 What happens to the exchange rate and asset prices at peak and low levels of global risk aversion?
During the recent global financial crisis – a combination of shocks that include the subsequent recession and period of heightened uncertainty – changes in global-investor risk perceptions had a significant impact on some macroeconomic variables. This particularly impacted the exchange rate, stock prices, short-term interest rates and policy rates. Theory suggests that the exchange rate dynamics affect the country’s competitiveness with its trading partners. Changes in asset prices and interest rates affect funding costs and the assessment on investment opportunities and decisions by the corporate sector.
Global risk aversion, as measured by the VIX index, increased to unprecedented levels during the recent global financial crisis in 2007. The VIX index is a measure of the implied volatility of the Standard and Poor’s 500 (S&P 500) index options. The VIX index measures market expectations of stock market volatility over the next 30-day period. In Figure 1.1 we show monthly (M) data for the VIX index, the South African rand exchange rate to the US dollar, the South African ten-year government bond yield and the All-share price index (Alsi) for the period July 1995 to July 2010.
From Figure 1.1 (a) it is evident that the VIX index tends to move in the opposite direction of stock prices, as measured by the Alsi, whereas, there tends to be a positive relationship with the rand exchange rate to the US dollar. The Alsi increased from nearly 7,764 index points in April 2003 to around 29,146 index points in September 2007. This trend occurred when the VIX index was at very low levels for a prolonged period (below 30 index points). However, this trend was reversed, and the negative association is clearly visible, after July 2009. The VIX index increased from 18 index points in May 2008 to 62 index points, and this coincided with a fall in the Alsi from 32,300 index points to 19,886 index points over the same period. Moreover, in Figure 1.1 (d) the spread between high and low points in stock prices tend to widen when the VIX index rises.
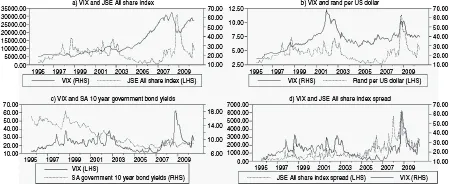
Figure 1.1 The VIX index, and selected South African financial variables
Source: Bloomberg, IMF IFS, South African Reserve Bank (SARB).
In addition, there seems to be a positive relationship between the rand per US dollar exchange rate and the VIX index, as shown in Figure 1.1 (b). The peaks in the rand per US dollar exchange rate depreciation tend to coincide with peaks in the VIX index. South African government bond yields also seem to be positively related to the VIX index.
The relationships shown in Figure 1.1 suggest that changes in global-investor risk perceptions impact South African financial variables. The recent global financial crisis has shown that the interpretation of signals from individual variables tends to convey incomplete information about the financial conditions in the economy. The Financial Stress Index (FSI), which aggregates the financial information can be used to test the transmission of financial stress into the broader economy. The FSI can be used to assess the extent to which it magnifies the impact of macroeconomic shocks.
1.2 Do foreign and South African asset prices move together?
Various empirical studies have established that asset prices in different countries tend to move together and to propagate the impact of adverse financial shocks on the macro-economy. It is also well established in the literature that stock prices are among the leading indicators of real economic activity. Figure 1.2 shows in (a) the trend between South African government bond yields and euro area bond yields; in (b) the South African government bond yields and US bond yields; and in (c) the stock price indices for the S&P 500 and Alsi. All the data used is at a quarterly (Q) frequency for the period 1985Q1 to 2012Q4. All the graphs and the accompanying scatterplots show a positive relationship between South African and foreign variables.
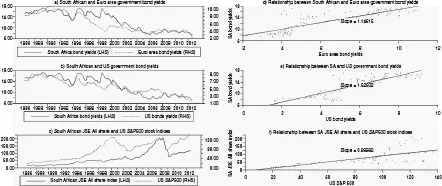
Figure 1.2 Co-movement in asset prices
Note: The stock price indices are based on 2010 = 100.
Source: IMF IFS and own calculations.
The scatterplots in Figure 1.2 suggest a positive relationship. The lack of a perfect fit in bilateral relationships indicates that these variables are explained by other factors not accounted for in the scatterplots. Against this background, we assess the impact of an unexpected shock from US and some euro-area countries’ bond yields on South African bond yields. In Chapter 4 and 5 we add more variables in the analysis to identify the possible channels of the transmission of these unexpected shocks.
1.3 The relationship between G7 economic growth and South African growth
The synchronised contraction in the global economic growth in 2008 provided further confirmation of the extent to which economies are interconnected, as suggested by the economics repercussions theory. As an introduction to the analysis of the spillovers, in Figure 1.3 we show the bilateral relationships. We use data in quarterly (Q) frequency spanning the period 1998Q1 to 2012Q4.
Figure 1.3 shows a positive relationship between G7 and South African economic growth rates. G7 growth tends to lead South African growth – Figure 1.3 (a) – and that G7 growth contracted much earlier in comparison to South African growth during the recent global financial crisis and recession. In Figure 1.3 (b), about 34 per cent of South African economic growth is explained by G7 growth dynamics. This indicates that South African growth is also explained by other factors rather than predominantly G7 economic growth. Chapter 2 investigates and identifies economies within the G7 countries that exert positive growth shocks on the South African economy. To enrich the analysis, we distinguish between the direct and indirect channels of transmission. South Africa is part of the BRIC economies and, hence, Chapter 3 assesses the growth spillovers from BRIC economies.
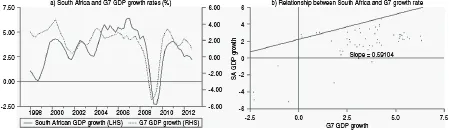
Figure 1.3 G7 and South African economic growth rates (per cent)
Source: OECD.
1.4 Correlation between South African trade variables and G7 economic growth
South African trade declined during the global crisis. Th...
Table of contents
- Cover
- Title
- 1 Introduction
- Part I Growth Spillover Effects
- Part II Spillovers of Foreign Financial Shocks
- Part III Capital Flow Effects and the Trade Balance
- Part IV Equity Markets Interdependence and Financial Stress
- Notes
- References
- Index
Frequently asked questions
Yes, you can cancel anytime from the Subscription tab in your account settings on the Perlego website. Your subscription will stay active until the end of your current billing period. Learn how to cancel your subscription
No, books cannot be downloaded as external files, such as PDFs, for use outside of Perlego. However, you can download books within the Perlego app for offline reading on mobile or tablet. Learn how to download books offline
Perlego offers two plans: Essential and Complete
- Essential is ideal for learners and professionals who enjoy exploring a wide range of subjects. Access the Essential Library with 800,000+ trusted titles and best-sellers across business, personal growth, and the humanities. Includes unlimited reading time and Standard Read Aloud voice.
- Complete: Perfect for advanced learners and researchers needing full, unrestricted access. Unlock 1.5M+ books across hundreds of subjects, including academic and specialized titles. The Complete Plan also includes advanced features like Premium Read Aloud and Research Assistant.
We are an online textbook subscription service, where you can get access to an entire online library for less than the price of a single book per month. With over 1.5 million books across 990+ topics, we’ve got you covered! Learn about our mission
Look out for the read-aloud symbol on your next book to see if you can listen to it. The read-aloud tool reads text aloud for you, highlighting the text as it is being read. You can pause it, speed it up and slow it down. Learn more about Read Aloud
Yes! You can use the Perlego app on both iOS and Android devices to read anytime, anywhere — even offline. Perfect for commutes or when you’re on the go.
Please note we cannot support devices running on iOS 13 and Android 7 or earlier. Learn more about using the app
Please note we cannot support devices running on iOS 13 and Android 7 or earlier. Learn more about using the app
Yes, you can access Global Growth and Financial Spillovers and the South African Macro-economy by Mthuli Ncube,Eliphas Ndou,Nombulelo Gumata in PDF and/or ePUB format, as well as other popular books in Economics & Financial Services. We have over 1.5 million books available in our catalogue for you to explore.