
eBook - ePub
A Practical Guide to Corporate Finance
Breaking the Financial Ice
- English
- ePUB (mobile friendly)
- Available on iOS & Android
eBook - ePub
A Practical Guide to Corporate Finance
Breaking the Financial Ice
About this book
This textbook offers an approachable guide to all key concepts within corporate finance. Emphasizing the use of common sense rather than number-crunching models, it provides a compact, easy to read experience for any reader, practitioners and students alike, whatever their background.
A Practical Guide to Corporate Finance begins with the basics of how to read financial statements and how to estimate future cash flows. It also includes a guide to subjects such as capital budgeting decisions, the cost of financing for businesses, cash and working capital management, the process of business valuation, and how stock markets work.
This textbook breaks the financial ice by offering real, practical advice, helping the reader to avoid common pitfalls, and translate the 'financialese', or business jargon that can cause confusion for those without a financial or banking background. Every chapter features real-life applications, and is punctuated with mini case studies in the form of a 'Slice of Life' and numerous dialogues that help shape the comprehension of the reader.
Trusted by 375,005 students
Access to over 1.5 million titles for a fair monthly price.
Study more efficiently using our study tools.
Information
1
Financial Analysis
The world is full of obvious things which nobody by any chance ever observes.
Sir Arthur Conan Doyle, The Hound of the Baskervilles (1901)
Financial analysis involves reading a company’s financial statements and trying to squeeze the juicy details out of them: how old the captain is, the age of the machines and the overall performance of the business. This requires a minimum skill set and a great deal of ingenuity. Financial analysis is often one of the first steps in business management: a prerequisite for making good decisions is having first understood what the business is all about.
Accounting
A lot of people will never overcome their aversion to accounting. A discipline that is generally deemed to be a bit sad and dreary, accounting is nevertheless – on the scale of human endeavour – what the lone star tick (amblyomma americanum) is to the world of living things: something repulsive to the eye, but in reality a marvel of inventiveness. So you will have to set aside your preconceived notions: to work in finance you can get by just fine without any knowledge of the lone star tick, but if you want to survive, you need to understand the mechanics of business accounting.
Financial statements
Every year companies publish several financial statements in their annual report. These statements show what has happened during the year. The two main statements are the balance sheet and the income statement (P&L account). Here is a brief presentation:
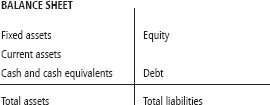
Figure 1.1 Balance sheet
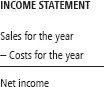
Figure 1.2 Income statement
The income statement shows the operations that have occurred during the year, so it is like a post-game summary (both half-times1) and the bottom line (positive or negative) is the final score of the game. The balance sheet represents the state of affairs at the end of the year when the accounts are closed. This is the final standing – the championship ranking.
VIGNETTE
Mario Imbroglio sets out across Europe in his red Ferrari Testarossa. The ‘balance sheet’ at the end of the day refers to the final state of the car. For example, the seats, stereo and steering wheel are still there. The tyres are a little worn. There are 22 litres of petrol in the tank and the small tray under the dashboard contains £5.60 in small change, two £100 speeding tickets, and 53 toll receipts. The income statement corresponds to a tally of Mario’s exploits: he went to an ATM 12 times, withdrawing a total of £1,250, which he used to pay for 7 fill-ups (£700), 5 overpriced roadside snacks (£200) and 53 tolls (£344.40).2
VIGNETTE 2
Last year, the author of this book earned £65,000 in salary and book royalties and spent £63,000 on trifles (housing, food, clothing, transportation, holidays, taxes and so on). This is his income statement. On 31 December his current account balance was −£212, his stock market portfolio was worth £4,578 and his house was valued at £300,000 (with £299,000 of principal left to pay on his mortgage). That’s his balance sheet.3
Now we’re going to set up a concrete illustration that will guide us through this chapter.
Droids Co. make machine tools. Their customers are automobile factories with specific needs. Their suppliers are small subcontractors (electronic and mechanical components, steel, cables and so on) as well as utilities and service providers (energy, insurance and so on). We will read their financial statements and learn how to interpret them as we go along. Serious readers can repeat this process every time they want to read a company’s financial statements.
Income statement
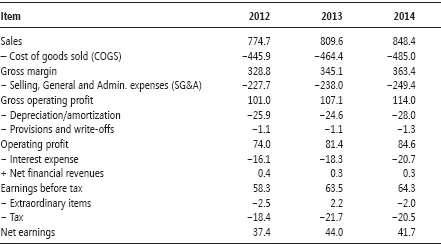
Table 1.1 Income statement
FINANCIALESE4
Sales represents sales revenue (volume sold × selling price). COGS (cost of goods sold) is the expenses invoiced by suppliers: raw materials, energy, rent, outsourced work and various other costs. Gross margin therefore represents the margin on sales after paying for supplies.
SG&A (selling, general and administrative) expenses include all staff salaries (shop floor workers, salespeople, executives) as well as other payroll costs such as social security contributions. Gross operating profit is therefore the margin on sales after paying production costs and overheads.
A word about depreciation/amortization and provisions
Depreciation and amortization are accounting entries which, unlike other items in the income statement, do not correspond to monetary operations. Specifically, depreciation/amortization5 is the process of spreading the cost of a past investment over time. Companies are not allowed to write off an investment as a one-time expense; that would be the equivalent of charging the entire cost of an asset to the accounts of a single year, even though that asset will be used for several years. The accounting solution is to deduct the expense gradually, in instalments, over the useful life of the asset. Some people say that depreciation reflects the wear and tear on the asset, but mainly it is an accounting device to spread out the cost of the investment over time.
| DIALOGUE | |
| Rosencrantz: | On Droids Co.’s income statement we see £24M to £28M of depreciation per year. What does that mean? |
| Guildenstern: | Those amounts correspond to an investment of £250M spread over ten years. The investment actually did occur, but you are not allowed to record −£250M in one go on the income statement. So the expense is spread over time and the accounting representation of this operation is −£24M to −£28M per year over ten years. |
Provisions are accounting entries for potential losses such as inventory write-downs or doubtful debt. For example, if an outstanding customer payment is unlikely to be received, a provision is recorded to reduce the net earnings. Should the payment be made after all, the provision is cancelled, thereby increasing the net earnings (see the analysis of the asset side of the balance sheet below).
FINANCIALESE
The operating profit, therefore, is what is left of sales revenue after operating costs have been deducted and investment costs and asset depreciation have been spread over time.
Finance costs include the interest payments on debt and any foreign exchange losses. Financial revenues may be earnings from (short-term) investments, foreign exchange earnings or earnings from shares held in other companies. The sum of these two lines is the net financial expense/income...
Table of contents
- Cover
- Title
- Introduction
- 1 Financial Analysis
- 2 The Time Value of Money
- 3 Capital Budgeting
- 4 Risk and Profitability – Stock Portfolios
- 5 Cost of Capital and Capital Structure Policy
- 6 Business Valuation
- 6¾ Revenge of the Betas: A Bonus Chapter for Insomniacs
- 7 The Stock Market
- 8 Cash Management and Risk Management
- 9 Conclusion
- Index
Frequently asked questions
Yes, you can cancel anytime from the Subscription tab in your account settings on the Perlego website. Your subscription will stay active until the end of your current billing period. Learn how to cancel your subscription
No, books cannot be downloaded as external files, such as PDFs, for use outside of Perlego. However, you can download books within the Perlego app for offline reading on mobile or tablet. Learn how to download books offline
Perlego offers two plans: Essential and Complete
- Essential is ideal for learners and professionals who enjoy exploring a wide range of subjects. Access the Essential Library with 800,000+ trusted titles and best-sellers across business, personal growth, and the humanities. Includes unlimited reading time and Standard Read Aloud voice.
- Complete: Perfect for advanced learners and researchers needing full, unrestricted access. Unlock 1.5M+ books across hundreds of subjects, including academic and specialized titles. The Complete Plan also includes advanced features like Premium Read Aloud and Research Assistant.
We are an online textbook subscription service, where you can get access to an entire online library for less than the price of a single book per month. With over 1.5 million books across 990+ topics, we’ve got you covered! Learn about our mission
Look out for the read-aloud symbol on your next book to see if you can listen to it. The read-aloud tool reads text aloud for you, highlighting the text as it is being read. You can pause it, speed it up and slow it down. Learn more about Read Aloud
Yes! You can use the Perlego app on both iOS and Android devices to read anytime, anywhere — even offline. Perfect for commutes or when you’re on the go.
Please note we cannot support devices running on iOS 13 and Android 7 or earlier. Learn more about using the app
Please note we cannot support devices running on iOS 13 and Android 7 or earlier. Learn more about using the app
Yes, you can access A Practical Guide to Corporate Finance by Christophe Thibierge,Andrew Beresford in PDF and/or ePUB format, as well as other popular books in Business & Business General. We have over 1.5 million books available in our catalogue for you to explore.