- English
- ePUB (mobile friendly)
- Available on iOS & Android
eBook - ePub
Emerging Markets and Sovereign Risk
About this book
Emerging Markets and Sovereign Risk provides case studies, commentary and analysis on the financial risk management and measurement in the context of frontier and developing counties from international experts covering three key areas of emerging market investments, the rating sovereign risk and managing sovereign risk.
Trusted by 375,005 students
Access to over 1.5 million titles for a fair monthly price.
Study more efficiently using our study tools.
Information
Part I
Risk and Emerging Market Investment
1
Economic Growth vs. Equity Returns in Emerging Markets
R. McFall Lamm, Jr.
1 Background
An important controversy in modern finance is the conclusion by some researchers that countries with high economic growth rates do not deliver superior equity returns versus nations growing slowly. The absence of a positive growth-return correlation was first suggested by Siegel (1998). In a comprehensive and influential study covering 16 countries and using a century of history extending back to 1900, Dimson, Marsh, and Staunton (henceforth DMS) (2002) found that the growth-return correlation was actually negative. Ritter (2005) employed somewhat different sources and reported that the growth-return correlation was zero for 19 developed markets from 1970 to 2002 and negligible for 13 emerging markets using data from 1988 to 2002. DMS (2010) updated their original work and confirmed that for 44 countries, there was no statistically significant relationship between growth and returns.
The implications of these findings are far-reaching. For example, if equity returns are no greater from investing in high-growth emerging markets, then there is little reason for international capital to flow in their direction, presuming that equity market performance parallels capital returns. There could be portfolio diversification benefits, of course, but this rarely serves as the primary motivation for investing in emerging markets. DMS and Ritter argue that committing funds outside one’s own country is essentially pointless from a return perspective, a counter-intuitive proposition.
Most economists believe that the free flow of international capital to high-growth countries rewards investors with superior returns while simultaneously allowing recipients to grow faster than if they had relied solely on internally generated financing. Nonetheless, the DMS and Ritter conclusions have been accepted by a broad swath of the investment world. For example, Saldanha (2010) concurs with DMS and Ritter, arguing that strong economic growth by itself is not likely to produce superior equity market performance. Davis, Aliaga-Diaz, Cole, and Shanahan (2010) replicate DMS and Ritter’s results, and caution against emerging market investment in anticipation that more rapid economic growth will lead to higher returns. Barra Research (2010) also confirms the DMS and Ritter findings, and contends that a zero growth-return correlation is justified due to earnings dilution and the fact that high growth is already reflected in current stock prices.
A few investment professionals have challenged DMS and Ritter. O’Neill, Stupnytska, and Wrisdale (2011) argue that the link between GDP growth and equity returns is in fact very strong – as long as growth expectations are taken into account. Anderson (2011) makes the case that returns in one’s home currency from investing in high-growth markets are in fact correlated with macro outcomes, although no proof is presented.
In this chapter, I consider the growth-return puzzle from a global investor’s perspective and concur with those who dispute DMS and Ritter. I specifically argue that DMS and Ritter focus on the wrong metric – country growth versus local equity returns rather than growth versus the equity return that an international investor would receive. When one looks at the world from this latter perspective, I demonstrate that the growth-return correlation is positive and statistically significant. This conclusion holds for a variety of different countries and time periods.
2 What does intuition tell us?
There is a strong foundation for presuming that the growth-return relationship should be positive. On a simple accounting basis, GDP equals the sum of wages, profits, rents, and other factor returns. If the profit share of GDP is relatively constant, as it is for many countries, then more rapid economic growth should produce a proportionately high rate of profit growth in a closed economy. Equity returns should rise in parallel as long as valuations (price-to-earnings ratios) are stable.
For sure, there are extraneous factors that might distort a positive growth-return correlation. For example, most economies are open and the dominant companies in any market may be global firms that earn virtually all of their profits offshore. One would expect a very weak or no relationship between stock returns and GDP growth in such a situation. The Swiss market is a good illustration where Nestle, Novartis, Roche, UBS, and Credit Suisse account for 70% of the Swiss Market Index. Switzerland’s economic growth is largely irrelevant to the earnings of these multinational firms and their stock returns.
Another mitigating influence that might alter the growth-return relationship is the time horizon considered. For example, examining growth versus returns for Japan over a few years before or after 1989 would be very misleading – the period encompasses the build-up and bursting of the greatest equity bubble ever with valuations surging to extraordinary levels.
Supporters of DMS and Ritter suggest other reasons for an absence of any relationship between growth and returns. Market participants may have already bid up stock prices in high-growth countries; political developments could fundamentally shift the profit share of the economy; or firms may not pass through total earnings growth to investors because of share dilution. These possibilities are credible and could neutralise a positive growth-return relationship. It is thus perhaps not surprising that many people accept the DMS and Ritter thesis as unadulterated fact.
Nonetheless, there is a flipside to these arguments, and it is not clear why the growth-return relationship should be zero. Most companies in major equity markets do have strong home country exposure.1 Furthermore, if stock prices are already bid up to reflect expected growth, then early arrivers should benefit; bubbles contained in any sample can be addressed by lengthening the time horizon considered; and share dilution is in reality not excessive in most markets. In addition, among others, Fama (1981) and Bakaert and Harvey (2000) point to theoretical reasons why the relationship between growth and equity returns should be positive, although the interaction is complex and involves factors such as economic structure and currency volatility.
3 Relevant growth-return metrics
Of critical importance is the way the growth-return relationship is measured. In a world of international capital mobility where investors constantly scour the globe searching for higher stock returns than are available domestically, it seems rational to expect that a country growing 10% annually would offer more than a stagnant economy. However, the comparison needs to be made in the global investor’s home currency since changes in foreign exchange values could offset gains or accentuate losses.
DMS and Ritter compare economic growth to equity returns for their sample countries on a local currency basis. While this is appropriate for residents, it is irrelevant to external investors – DMS and Ritter neglect currency translation, which ultimately determines the returns that outsiders receive. To argue that there is no relationship between local returns and growth does not matter to the international investor who cares only whether there is a relationship between local growth and the realized return denominated in their home currency.
In a world of permanently fixed exchange rates, this would not matter. But the reality is that currency values fluctuate, rising or falling over the long run depending on relative fiscal and monetary policy as well as structural changes such as privatisations and other political reforms. There is no reason to believe that changes in currency values will exactly offset equity gains or losses for investors who purchase foreign stocks.
Supporters of DMS and Ritter will no doubt argue that the local growth-return relationship is pertinent because an outside investor can hedge away currency exposure and thereby reap the same equity return as a local investor. However, hedging is often very expensive and needs to be explicitly taken into account, which DSM and Ritter do not.
4 A case study of the US and UK growth-return relationship
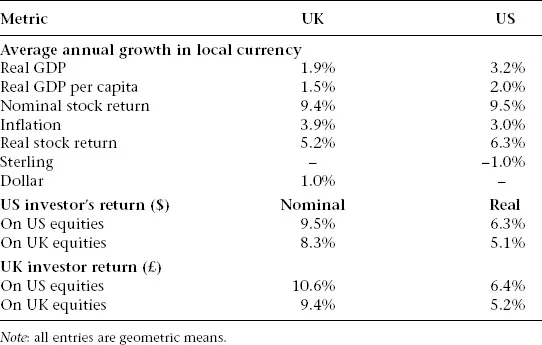
The US and UK offer an excellent starting point for examining the issue – available data for these two countries are the most comprehensive available over a long period of time. I take UK real GDP, inflation, and sterling/dollar rates from Thomas, Hills, and Dimsdale (2010, updated) and UK equity returns from DMS.2 For the US, I use real GDP data from Balke and Gordon (1986) up to 1928 and from the US Dept. of Commerce thereafter. US equity returns are from Shiller (2005, updated). Results for this sample, which covers 112 years from 1900 to 2012, are summarised in Table 1.1.
My conclusions are the following. First, nominal equity returns are almost exactly the same in the UK and US, averaging 9.4% and 9.5% per year, respectively. However, real equity returns in the US are 1.1% higher due to UK inflation averaging close to 1% more annually. Over the sample period, real GDP in the US grew 1.3% faster in aggregate and 0.5% more per capita annually than in the UK. US domestic investors experienced higher real equity returns compared with their UK counterparts.
Second, US investors were well advised to stay at home in their own high-growth market, while UK investors should have invested abroad in the higher-growth US. In fact, US investors would have underperformed by 1.2% annually in real terms on funds invested in the UK, while UK investors would have gained a similar amount each year by investing in the US. This differential approximates the 1% fall in sterling vs. the dollar and compounds to a huge cumulative outperformance over time.
Table 1.1 Equity returns vs. economic growth for the US and UK – 112 years from 1900 to 2012
There are extended periods within the sample where the performance difference is muted. This is why Ritter shows UK vs. US real returns of 4.8% and 5.2% from 1970 to 2002 compared with GDP per capita growth of 2.1% vs. 1.9%. Over Ritter’s 33-year window, there is no growth-return correlation.3 It appears that sometimes a long investment horizon is necessary for the growth-return relationship to fully reveal itself. Regardless, the very long-run US-UK growth-return relationship is positive on a local currency basis, in dollars or in sterling.
The analysis is revealing in another way – the growth-return differential is stronger for aggregate GDP growth than on a per capita basis. The US economy expanded more than 1% faster annually than the UK, which aligns nicely with the real return differential of 1.2%. However, on a per capita basis, the growth differential is only 0.5%, which is not a lot. This raises the question of why one should focus on per capita rather than aggregate growth. The latter seems preferable since the investor should be indifferent as to whether equity returns arise from market growth due to population expansion or as a result of productivity gains.
5 Emerging markets vs. developed economies
Moving beyond a simple two-country comparison, I turn to emerging versus developed markets as represented by broad indices. Reliable equity return data for emerging markets begin in 1987, so this limits the sample to 25 years from 1988 to 2012. I use MSCI dollar returns for both developed and emerging markets deflated by the US consumer price index. For real GDP growth, I take reported World Bank growth rates for two groups: ‘low- and middle-income’ countries, a proxy for emerging markets; and the bank’s ‘high-income’ category to represent developed economies. This not an exact one-for-one match because the growth and return series have different country weights; therefore, the comparison is proximate.
Table 1.2 shows the results. In sum, real economic growth in low- and middle-...
Table of contents
- Cover
- Title
- Part I Risk and Emerging Market Investment
- Part II Rating Agencies and the Sovereign Rating Process
- Part III Management of Sovereign Risk and Ratings
- Index
Frequently asked questions
Yes, you can cancel anytime from the Subscription tab in your account settings on the Perlego website. Your subscription will stay active until the end of your current billing period. Learn how to cancel your subscription
No, books cannot be downloaded as external files, such as PDFs, for use outside of Perlego. However, you can download books within the Perlego app for offline reading on mobile or tablet. Learn how to download books offline
Perlego offers two plans: Essential and Complete
- Essential is ideal for learners and professionals who enjoy exploring a wide range of subjects. Access the Essential Library with 800,000+ trusted titles and best-sellers across business, personal growth, and the humanities. Includes unlimited reading time and Standard Read Aloud voice.
- Complete: Perfect for advanced learners and researchers needing full, unrestricted access. Unlock 1.5M+ books across hundreds of subjects, including academic and specialized titles. The Complete Plan also includes advanced features like Premium Read Aloud and Research Assistant.
We are an online textbook subscription service, where you can get access to an entire online library for less than the price of a single book per month. With over 1.5 million books across 990+ topics, we’ve got you covered! Learn about our mission
Look out for the read-aloud symbol on your next book to see if you can listen to it. The read-aloud tool reads text aloud for you, highlighting the text as it is being read. You can pause it, speed it up and slow it down. Learn more about Read Aloud
Yes! You can use the Perlego app on both iOS and Android devices to read anytime, anywhere — even offline. Perfect for commutes or when you’re on the go.
Please note we cannot support devices running on iOS 13 and Android 7 or earlier. Learn more about using the app
Please note we cannot support devices running on iOS 13 and Android 7 or earlier. Learn more about using the app
Yes, you can access Emerging Markets and Sovereign Risk by N. Finch in PDF and/or ePUB format, as well as other popular books in Business & Corporate Finance. We have over 1.5 million books available in our catalogue for you to explore.