
- English
- ePUB (mobile friendly)
- Available on iOS & Android
eBook - ePub
About this book
Understanding the American stock market boom and bust of the 1920s is vital for formulating policies to combat the potentially deleterious effects of busts on the economy. Using new data, Kabiri explains what led to the 1920s stock market boom and 1929 crash and looks at whether 1929 was a bubble or not and whether it could have been anticipated.
Trusted by 375,005 students
Access to over 1.5 million titles for a fair monthly price.
Study more efficiently using our study tools.
Information
1
Introduction
The financial crisis of 2008 has rekindled interest in topics within the diverse field of economics, ranging from understanding systemic risk within the global banking system (Acharya, 2009), to how the financial system interacts with the real economy (Bayoumi and Darius, 2011), to the neuronal activity of the human brain during asset bubbles (De Martino et al., 2013). These extremely complex and enlightening fields will drive research into many interesting questions in economics for the coming decades and promise a great insight into these areas.
What the devastating effects of the crisis have also done is to bring the study of economic history, historical finance and the history of economic thought back into the consciousness of the general public and the mainstream of economics. There are some parallels drawn between the 1920s–1930s Great Depression and today due to the widespread and prolonged crises common to both periods, and hence a natural tendency to look back at the economic history of that period has become evident.
History matters. The reason why we should be concerned about ensuring that its relevance to economics and the social sciences is cultivated is that human thought, and the economic systems which we form, are in a constant state of change. Yet, many aspects of human behaviour are common to all times. Being able to grasp this subtle concept is a cornerstone of understanding economics. Although we do not seek to pre-empt the conclusions of the book, it appears that financial history contains periods of less than rational behaviour. The aim of the research was to conduct comprehensive tests to establish whether an overvaluation of the US stock market occurred and identify potential causes and its underlying nature. The study of long-term data, when controlling for potential changes through time, can yield powerful insights about how the economy and economic actors behave. The research also aimed to understand asset valuation in its historical context, by basing our assessment of investors’ behaviour on the valuation models they used. This is important for the rigour of our conclusions and also because the tools of financial analysis developed in the 1920s and 1930s have shaped the development of modern finance theory.
The state of the art in research into asset bubbles comes from the new field of neuro-economics, which is likely to be important in the development of economics over the next decades. This discipline draws on two fields – psychology and economics – to see how microeconomic behaviour is influenced by human psychology. This is a complement to more classical ideas on rational behaviour, but rather than depend on the restrictive assumptions of rational human behaviour at all times, aims to investigate what occurs when rational economic behaviour does not occur, such as during asset bubbles.
A good example of the advances being made is De Martino et al.’s paper ‘In the Mind of the Market: Theory of Mind Biases Value Computation during Financial Bubbles’ (2013). The research aims to measure the human brain’s activity to understand the neuronal processes, and subsequent behavioural processes which they lead to, during asset bubbles. In a laboratory setting, using brain-imaging techniques normally used in the field of medicine, these tests reveal how economic behaviour is generated. De Martino et al. find that the formation of bubbles is linked to increased activity in an area of the brain that processes value judgements. People who had greater activity in this area of the brain were more likely to ride the bubble in a trading game, and lose money by paying more for an asset than its fundamental worth. During tests where fundamental values were no longer adhered to by traders, they also found a strong correlation between activity in the value processing part of the brain and another area that is responsible for computing social signals to infer the intentions of other people and predict their behaviour. This new and exciting work has a historical precedent, the ‘Beauty contest’ analogy (Keynes, 2007 [1936]). In this explanation of bubble formation and general price formation in financial markets, the adoption of higher-order beliefs occurs where the market price is not determined by absolute value judgements of the assets’ worth. According to this view, the best strategy is to guess what average opinion thinks the value of a security will be. What the new research direction shows is how complex and enigmatic ‘bubbles’ are, and also that answers to the major questions of economics can be aided by innovative techniques based in other major fields of study.
Another equally vital area of research is the use of survey data to test expectations of investors directly. In Greenwood and Shleifer’s ‘Expectations of Returns and Expected Returns’ (2013), the authors test whether expected returns and expectations of returns diverge and provide insight on why returns may exceed fundamentals using multiple sources of investor surveys.
The study of financial history and historical finance has an equally, if not more vital role to play in the resolution of whether bubbles form in the real world. This is exemplified by the work of Yale University and the International Centre for Finance, where detailed historical analysis of financial markets and financial analysis of long-term financial data have made the study of finance, and especially asset bubbles, more viable. Having a reference point for both long-term asset returns and economic growth enhances our knowledge of fair expected returns. Being able also to measure realised returns over the long term provides the reference points needed to make useful inferences about investor behaviour and represent bubbles in the light of this fundamental expectation and subsequent realisation. Our research draws heavily on such an approach to set the benchmark, and then we analyse whether the deviation of the benchmark displays evidence of irrationality. Seminal work by R. J. Shiller, the joint winner of the Sveriges Riksbank Prize in Economics in memory of Alfred Nobel with E. F. Fama and L. P. Hansen in 2013, published in the American Economic Review (Shiller, 1981), showed that long-term historical studies of asset prices yielded powerful tests of market efficiency. The paper showed that in the broad market index of stock prices the latter have deviated from their fundamental values in long- and short-run swings of under and overvaluation over long-term US financial market history.
Laboratory studies, where a market is created in controlled settings (a key innovation in how bubbles are studied), have the potential to resolve questions about economic behaviour and the formation of asset bubbles. Smith et al. (1988) showed, in a controlled setting with live participants, how asset prices could deviate from known fundamental values. Smith’s work went on to earn him the Nobel Prize in Economics in 2002 for work in experimental asset markets. From these seminal modern thinkers and the ability of economists to assemble and analyse large amounts of data, a field in behavioural finance developed in tandem with similar research on behavioural economics. The field of behavioural economics became influenced heavily by the allied social sciences, in particular psychology, with Daniel Kahneman being awarded the Nobel Prize alongside Vernon Smith in 2002.
We focus on a particular time period and on a specific market. Figure 1.1 represents a broad market index of US Common Stocks, and uses data from Shiller (n.d.) taken from Cowles (1938) to show the extent of the boom and crash. It is truly spectacular and terrifying depending on where a hypothetical investor bought and sold. Throughout the book, we use these data to look at the broad market for US Stocks. These are the data used in Shiller (2000, n.d.) to estimate the S&P 500 broad market index over long-term US financial history. We use this measure to represent the US stock market, but we also take direct measures from the cross-section of stocks when we conduct our econometric tests.
The Cowles (1938) index is widely acknowledged to be a good gauge of the US stock market (Goetzmann and Ibbotson, 2006). We use the Cowles index throughout the book as a proxy for the US stock market, unless otherwise stated.
The movements of the prices of Common Stocks, which rose by 400 per cent from 1921 to 1929, and collapsed from 1929 to 1932, have been the subject of many analyses in the historical, popular, and technical economic literature. The process has drawn interest due to the scale of the boom and crash and its association with the largest economic contraction in US history in the twentieth century. Perhaps the most famous and telling account of the event remains the work of Galbraith (1954) who was the first to provide a general account of the boom and bust, and it has stood the test of time. The more technical account contained in Wigmore (1985) puts numbers and much detail to the boom and bust which Galbraith (1954) did not. In many ways, this book and the research it reports owe these scholars a great debt of gratitude. The works of Eugene White have also enlightened our understanding of the period, through much econometric and historical research on the 1920s boom. The study of the period is also indebted to the work of R. Shiller, William N. Goetzmann, and Roger Ibbotson. Their work on methods to detect asset bubbles, and long-term financial data and financial history have made the insights of the future generation of researchers in these fields materially richer.
We are now in a position to conduct some further tests and borrow from the insights of modern research in finance and economics, to provide a picture of the boom and bust. The book follows the tradition of a general account of the boom and crash with data on many aspects cited in Galbraith (1954).
The focus of this book is to present new data extending well before the Crash and data collected over the eighty years since, which allow us to estimate, in a more technically rigorous way, the dynamics of the boom and crash in the 1920s–1930s and answer the vital question as to whether a deviation from fundamental values occurred.
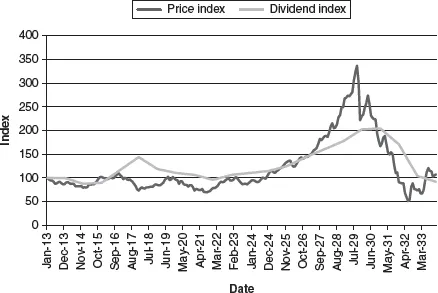
Figure 1.1 Prices and Dividend Index (Cowles) (Base = 100, Jan. 1913)
Source: Cowles (1938); Shiller (n.d.).
The econometric tests and the data and methods for the tests are also presented, so as to make the tests clear and therefore repeatable. It is hoped that some of these techniques will improve the general understanding of measuring asset bubbles. We use the term ‘bubble’ as a descriptive word, which means, only, a deviation of asset prices from their ex-post observable fundamental values. We do so with a measured degree of caution as the word has many connotations, which we do not want to invoke when using the term, such as a self-feeding increase in stock prices. One of the key findings of the research was that asset bubbles are very hard to detect ex-ante in this period.
The main aim is to offer the reader a better understanding of the boom and bust of the 1920s US stock market from a theoretical, historical, and econometric perspective. A second aim is to introduce or at least confirm to the reader the complex and enigmatic nature of asset bubbles and hence stimulate more research on the topic of how these phenomena actually form in the real world.
To this end it is worth introducing the reader to the history of economic thought on ‘bubbles’ and the state of the art in the field. In Chapter 2, on the current literature on this theme, we take a deeper look at how much we know about them.
The subject of market efficiency is an area whose study has only made serious headway in the last thirty years. Another aim of the book is in part to stimulate the further study of economic and financial history and to encourage research on bubbles, especially during new technological eras.
The 1920s stock market boom – the rise in values from 1921 to 1929 shown in Figure 1.1 – was caused in the first instance by an underlying monetary expansion of immense scale. The expansion is itself of great interest to many economists as the monetary system of the 1920s was different to today’s system. The monetary base was linked to gold, and the USA was operating on a Gold Standard, hence the central bank policy of the time, and its ability to sterilise international gold flows and thus control the supply of money in the USA is of interest. Showing how the US monetary/debt system changed to produce the boom of the 1920s is a key part of the research.
The newly formed Federal Reserve, born in 1913 to stabilise the US economy and banking system, and the central bank’s policy during the 1920s are integral to understanding the boom. Furthermore, the central bank’s policy towards the overvaluation, which they perceived, is also materially important.
The dynamics of the monetary system are key to seeing how stocks, which are nominal claims on future dividends, were affected by the monetary expansion of the time. The research also shows how the housing market’s debt system developed through the 1920s and later in the book we look at how this may have played a role during the Great Contraction from 1929 to 1932 via a nexus between highly leveraged home owners and the banking system which provided the home loans. Key features of the 1920s private and commercial property markets, which appear to have led to a bubble in the housing market (White, 2009), include the emergence of tradable securities in commercial real estate loans which funded the rise of New York and Chicago’s skyscraper boom (Goetzmann and Newman, 2012) and contributed to the crash in house prices due to the Great Contraction in the US economy from 1929–32.
Using methods developed by Goetzmann and Ibbotson (2006), and our own historical data set, we can estimate the level of the US stock market, which is justified based on long-term history. This approach follows that of Shiller (1981) and what emerges from our long-run data and the Equity Risk Premium (ERP) measure from Smith (1924) and using data from Goetzmann and Ibbotson (2006) is an estimate of how much stock values changed relative to expectation. The scale of the change was up to 50 per cent beyond expectation for the broad US market.
The main conclusion is that this phenomenon that we can see ex-post was driven by both ‘high expectations’ of returns for firms, thought to be creating or benefiting from a ‘new era’, as well as potentially lower risk premiums. These conclusions are based on the data we have access to, as we do not have access to expectations data from surveys of investors from the period. Thus we cannot resolve exactly to what extent each of the two components was responsible for the overvaluation relative to our models. We also show how there may have been legitimate reasons for the surge in valuation ratios for stocks by examining a technological shock occurring during the 1920s and the effect this may have had on valuations.
In line with our look at technological shocks and the stock market, we can measure realised returns to the 1920s stock market by looking at returns over the very long run for a proxy of the market portfolio. Using bespoke survival adjusted return data, from the 1920s to 2010 we can derive a measure of the ex-post return to the market portfolio. This allows us to test whether higher expectations of returns or changing risk premiums were justified ex-post. A major finding of the research is that the return to a diversified investor in 1925 was very similar to that expected over the long term before 1926 and was about 3.4 per cent in excess of the return to long-term Government Bonds based on data from 1925 to 2010. This level of return to stocks appears to be consistent with long-term returns prior to the 1920s. This also shows us that any high expectations of future returns in the 1920s were not forthcoming. This result does not, however, rule out that new technology could have driven the boom legitimately as high uncertainty pervaded the emergence of new technologies and could have legitimately increased ex-ante valuations, even if these dissipated ex-post (Pastor and Veronesi, 2009).
What we do is provide some sobriety to investors in the modern day who believe that stocks bought in the 1920s would have earned spectacular returns if held to the present, and also caution those who think that the Great Depression damaged long-term returns relative to historical expectation. Considering that equity instruments, or stocks, are by their very nature a claim on the dividends of a very long-lived asset, long-term investors would not have been disappointed given an accurately formed expectation if they bought in 1925.
New research from Gordon (2010) shows that the USA was on the verge of a huge deviation from its trend productivity growth path, which manifested from 1928 to 1950. Although the exact nature of this productivity surge is still the subject of research, acknowledging such a reality of a ‘new era’ in the USA is important if the dynamics of the 1920s boom and bust are to be understood. The real shift was not large enough to justify the changes seen in stock valuations. Nicholas (2008) shows patented technologies were being revalued in the 1928–9 phase of the boom and excess returns to these stocks remained after the crash. Janeway (2012), by contrast, identifies a similar step-change, but ascribes the dynamics of the post-war period to big-state capitalism and the willingness of the US federal government to buy a range of military technologies that could be shown fit for purpose or dangerous if developed by the enemy.
Our research points heavily towards a change in investor perceptions of the value of Common Stocks, which had no foundation in the historical or realised experience of investing. Ex-post experience of stock returns were in line with the prediction of history, and therefore it is hard to substantiate the claims that market prices rose to reflect a bright future for investors. Additional cross-sectional tests reveal that naïve extrapolation of earnings or dividends did not occur and only very weak momentum effects can be seen in the cross-section of stock returns from 1928–9. Furthermore, there does not appear to have been a systematic change in the ERP. These results indicate that whatever occurred in the 1920s boom was not predictable at the firm level. Our results are, however, still consistent with the idea that overvaluation could be detected ex-ante, as exemplified by De Long and Shleifer (1991) who illustrate a premium on financial assets whose ex-ante valuation can be calculated. Hence the potential for a technologically driven legitimate ex-ante rise i...
Table of contents
- Cover
- Title
- Copyright
- Contents
- List of Figures
- List of Tables
- Preface
- Acknowledgements
- Prologue
- 1 Introduction
- 2 Literature Review and Methodology
- 3 The US Economy and the Financial System
- 4 The Returns to US Common Stocks from 1871 to 2010
- 5 The October Crash of 1929 and the NYSE Credit System
- 6 The Great Contraction of 1929–1932 and the Value of Stocks
- 7 Conclusions
- Appendix: Results of cross-sectional tests
- Notes
- Bibliography
- Index
Frequently asked questions
Yes, you can cancel anytime from the Subscription tab in your account settings on the Perlego website. Your subscription will stay active until the end of your current billing period. Learn how to cancel your subscription
No, books cannot be downloaded as external files, such as PDFs, for use outside of Perlego. However, you can download books within the Perlego app for offline reading on mobile or tablet. Learn how to download books offline
Perlego offers two plans: Essential and Complete
- Essential is ideal for learners and professionals who enjoy exploring a wide range of subjects. Access the Essential Library with 800,000+ trusted titles and best-sellers across business, personal growth, and the humanities. Includes unlimited reading time and Standard Read Aloud voice.
- Complete: Perfect for advanced learners and researchers needing full, unrestricted access. Unlock 1.5M+ books across hundreds of subjects, including academic and specialized titles. The Complete Plan also includes advanced features like Premium Read Aloud and Research Assistant.
We are an online textbook subscription service, where you can get access to an entire online library for less than the price of a single book per month. With over 1.5 million books across 990+ topics, we’ve got you covered! Learn about our mission
Look out for the read-aloud symbol on your next book to see if you can listen to it. The read-aloud tool reads text aloud for you, highlighting the text as it is being read. You can pause it, speed it up and slow it down. Learn more about Read Aloud
Yes! You can use the Perlego app on both iOS and Android devices to read anytime, anywhere — even offline. Perfect for commutes or when you’re on the go.
Please note we cannot support devices running on iOS 13 and Android 7 or earlier. Learn more about using the app
Please note we cannot support devices running on iOS 13 and Android 7 or earlier. Learn more about using the app
Yes, you can access The Great Crash of 1929 by A. Kabiri in PDF and/or ePUB format, as well as other popular books in Economics & Financial Services. We have over 1.5 million books available in our catalogue for you to explore.