eBook - ePub
Rice Production Structure and Policy Effects in Japan
Quantitative Investigations
This is a test
- English
- ePUB (mobile friendly)
- Available on iOS & Android
eBook - ePub
Book details
Book preview
Table of contents
Citations
About This Book
Kuroda uses quantitative measures to investigate the rice production structure and effects of agricultural policies in Japan over the second half of the 20th century. Almost all policies have played negative roles in transferring paddy lands from small- to large-scale farms, which has slowed down to modernize the rice sector.
Frequently asked questions
At the moment all of our mobile-responsive ePub books are available to download via the app. Most of our PDFs are also available to download and we're working on making the final remaining ones downloadable now. Learn more here.
Both plans give you full access to the library and all of Perlego’s features. The only differences are the price and subscription period: With the annual plan you’ll save around 30% compared to 12 months on the monthly plan.
We are an online textbook subscription service, where you can get access to an entire online library for less than the price of a single book per month. With over 1 million books across 1000+ topics, we’ve got you covered! Learn more here.
Look out for the read-aloud symbol on your next book to see if you can listen to it. The read-aloud tool reads text aloud for you, highlighting the text as it is being read. You can pause it, speed it up and slow it down. Learn more here.
Yes, you can access Rice Production Structure and Policy Effects in Japan by Yoshimi Kuroda in PDF and/or ePUB format, as well as other popular books in Business & International Business. We have over one million books available in our catalogue for you to explore.
Information
Part I
Production Structure of the Rice Sector of Japanese Agriculture during the Second Half of the 20th Century
The Objectives of Part I
Part I is composed of three chapters. They are, Chapter 1: Changes in Postwar Japanese Agriculture, Problems Setting up, and the Analytical Framework; Chapter 2: Technology Structure of the Rice Sector of Japanese Agriculture: (I) A Translog Variable Cost Function Approach; and, Chapter 3: Technology Structure of the Rice Sector of Japanese Agriculture: (II) A Translog Variable Profit Function Approach.
The major objectives of Part I are twofold.
First, Chapter I will statistically investigate from the macroscopic point of view how the production structure of Japanese agriculture has changed during the postwar years, in particular, from around the mid-1950s when the Japanese economy as a whole started growing rather sharply to the early 2000s. It will try to find economic issues emerged in this process of drastic changes in the Japanese economy as a whole.
Second, Chapters 2 and 3 will expose briefly what methodology is most appropriate to quantitatively capture how such issues occurred during the period of drastic economic growth in Japan in the second half of the 20th century. To be more specific, throwing away the traditional analytical tools such as the C-D and CES production functions, these two chapters will introduce respectively the dual VC and the dual variable profit (VP in short hereafter) functions of the primal production function, based on the theory of the firm. They will analyze econometrically the over-time changes of the rice production structure of the Tohoku agricultural district (Tohoku in short hereafter. This name will apply to all agricultural regions),1 chosen as a representative rice-producing district. Using the parameter estimates of the translog-specified VC and VP functions, we quantitatively analyze the basic economic indicators of Tohoku. Chapters 2 and 3 quantitatively investigate elasticities of output (rice) supply and variable factor demands, the three sets of elasticities of factor substitutions – the Allen, Morishima, and McFadden elasticities (AES, MES, and SES), the rates and biases of technological change, the degrees of returns to scale, and the shadow values of paddy lands. The details of the methodologies will be given.
1
Changes in Post-war Japanese Agriculture Changes, Problems Setting Up, and the Analytical Framework
1.1 Introduction
The major objective of this chapter is to overview statistically how agricultural structure has changed and what sorts of problems Japanese agriculture faced from 1956 through to the early 2000s. More specifically, this chapter will try to clarify major problems by statistically investigating changes in: crops and livestock, transfers of farmland, the definitions and numbers of farm households, the budgets for agriculture as a whole, and changes in the budgets for agricultural research and extension activities. During this investigation the statistics of the rice sector of Tohoku will be observed in parallel to those for Japan, using the translog VC (Chapter 2) and VP (Chapter 3) function frameworks, respectively.
1.2 Statistical observations of post-war Japanese agriculture
1.2.1 Post-war agricultural production in Japan as a whole
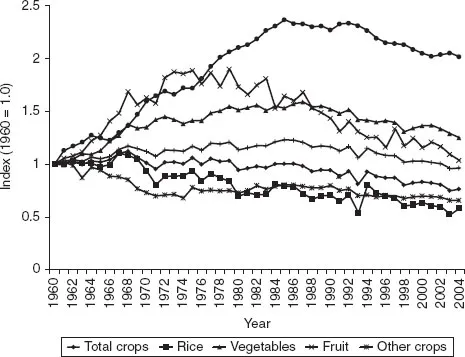
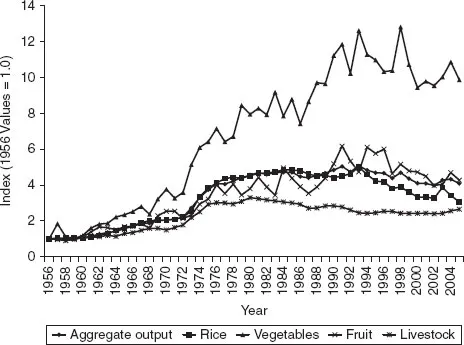
First of all, we will look into changes in the indexes of aggregate agricultural outputs in real terms for Japan as a whole (see Figure 1.1). According to Figure 1.1, the real total agricultural output has been stagnant since the late-1970s and even decreasing since around the mid-1980s. Behind such movements in the real total output, production of livestock and vegetables sharply increased from the early-1960s through to around the mid-1980s; in the case of fruit, however, production reached its peak around the late-1970s. The sharp increases in these products may have been due to the encouragement of the “Selective Expansion Production Programs” of the Basic Agricultural Act inaugurated by the government in 1961. In addition, as shown in Figure 1.2, the price movements of these products were considerably favorable; i.e, the price indexes of vegetables, fruit, and livestock had fairly sharp increasing trends during the late-1950s through to the early-1980s.

Figure 1.1 Changes in the indexes of total output, total crops, rice, vegetables, fruit, other crops, and livestock for 1960–2004 at 2000 prices: all Japan
Source: The statistical Department. The MAFF, The Nogyo · Shokuryo Kanrensangyo no Keizai Keisan (The Social Account for Agriculture and Food-Related Industries). 2006.
However, since around the mid-1980s, production of these three selective categories of products started declining consistently like the other products such as rice and other crops, which may have contributed to the declining trend of the amount of total agricultural output from the mid-1980s on. In particular, the output index of rice seems to have had the worst declining trend among all products presented in Figure 1.1. Behind the unfavorable movements of rice and livestock, we observe in Figure 1.2 that the price indexes of these products were stagnant or declining from around the early-1980s. This may have been caused by the government policies of reducing the producer prices of rice and livestock products, in particular, since around the mid-1980s towards the late-1990s.

Figure 1.2 Price indexes of major agricultural products for 1956–2005 at 2000 prices: all Japan
Source: The same as in Figure 1.1.
On the contrary, however, the price indexes of vegetables and fruit had increasing trends even after the early-1980s until around the mid-1990s against an opposite trend in production for these products (see Figure 1.1). This may imply an excess demand for vegetables and fruit from the early-1980s through to the mid-1990s. However, since then we observe decreasing prices for these two products, though with some volatility. As a result, production of vegetables and fruit began to decrease, which may indicate an excess of supply.
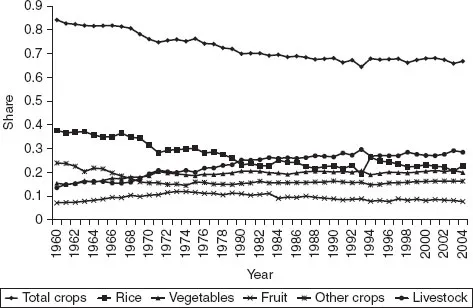
Figure 1.3 shows a decline in the share of livestock and vegetables in total agricultural output, which increased consistently over time. Although the share of fruit increased after 1960, it declined consistently between 1982 and the late 1990s. On the other hand, the share of rice consistently decreased over time from around 38 percent in 1960 to around 23 percent in 2004. As a matter of fact, the share of rice became smaller than that of livestock for the period 1982–2004; the share of livestock in 2004 was around 29 rather larger than that of rice, around 23 percent.

Figure 1.3 Changes in the shares of total crops, rice, vegetables, fruit, other crops, and livestock in the total amount of agricultural output for 1960–2004 at 2000 prices: all Japan
Source: The same as in Figure 1.1.
1.2.2 Post-war transfers of farmland in Tofuken and Tohoku
One of the primary concerns in Japanese agriculture since the Basic Agricultural Act was enacted in 1961 has been the implementation of more efficient and productive farming on larger-scale farmlands. This concern has recei...
Table of contents
- Cover
- Title Page
- Copyright
- Contents
- List of Figures
- List of Tables
- Foreword
- Foreword
- Preface
- Acknowledgements
- List of Abbreviations
- Introduction
- Part I: Production Structure of the Rice Sector of Japanese Agriculture during the Second Half of the 20th Century
- Part II: Impact of Agricultural Policies and Structural Transformation of the Rice Sector
- Notes
- References
- Index