eBook - ePub
Public Policy Challenges Facing Higher Education in the American West
- English
- ePUB (mobile friendly)
- Available on iOS & Android
eBook - ePub
Public Policy Challenges Facing Higher Education in the American West
About this book
Public Policy Challenges Facing Higher Education in the American West is the first regional public policy study of American higher education. Presidents of the Western State Commission for Higher Education and the National Center for Higher Education Management Systems, alongside nationally recognized policy analysts and current western campus presidents, provosts, and administrators, tackle seven key public policy issues facing postsecondary education in the American West: student access, federal research funding, state governance, state financing, state appropriations and their relationship to institutional tuition, distance education and technology, and the role of community colleges. These analysts, researchers, and administrators offer a clear and complete analysis of the facts of each policy situation, the public policy options, and their connections to state and university relationships. Fifteen western states, including Alaska, California, and Hawaii, comprise the expansive region under discussion. With its companion volume, Higher Education in the American West: Regional History and State Contexts, this book is essential reading for higher education policymakers, scholars, and anyone who wants to know what the relationship between states and universities in the West has been and where it is going.
Trusted by 375,005 students
Access to over 1.5 million titles for a fair monthly price.
Study more efficiently using our study tools.
Information
Part I
PUBLIC POLICY DEMOGRAPHIC BACKGROUND
1
A DEMOGRAPHIC PROFILE OF HIGHER EDUCATION IN THE AMERICAN WEST
Cheryl D. Blanco*
This chapter provides a limited set of data to outline a statistical profile of higher education for the western states. There was no attempt to gather all possible information that might inform the development of higher education in the West. Rather, data were selected to help the reader put other chapters of this book and the complementary policy papers in a context of numbers related to higher education as it serves the increasingly large and diverse population of the West.
The most comprehensive source for population data is the US Bureau of the Census, and much of the information in this section is taken from its reports and internet web pages. The Bureau of the Census presents data regionally in four sections. The region identified as the West by the bureau does not include North Dakota and South Dakota. As these states are members of the Western Interstate Commission for Higher Education (WICHE), information for these states has been incorporated in the regional data as part of the West whenever possible. The chapter begins with general population and demographic information on the United States and the western region, followed by data on educational institutions, enrollments, and degrees.
GENERAL DEMOGRAPHIC TRENDS
Population: United States
The first national population census occurred in 1790, more than a century after the establishment of the nation’s first institution of higher education at Harvard, chartered in 1636. The first census reported the population of the United States as 3.9 million.1 By the beginning of the twentieth century, the population had reached 76.2 million (Hobbs and Stoops, 2002, p. 17; Thelin, 2011, p. xxii).
Census data reveal tremendous growth in the US population in the 100 years that followed, as the population more than quadrupled from 76 million to 308.7 million people in 2010. This growth, however, was irregular, with two periods experiencing lulls and spurts: the Great Depression decade of the 1930s with the lowest numerical increase and the post–World War II baby boom with record population growth in the 1950s and the baby-boom echo following in the 1990s (Hobbs and Stoops, 2002, p. 17).
As the general population increased dramatically between 1900 and 2010, the nation also began experiencing several demographic shifts. According to a Census Bureau analysis, “As the United States entered the 20th century, most of the population lived in the Northeast or the Midwest, in non-metropolitan areas, was male, under 23 years old, White, and rented a home; nearly half lived in a household with five or more other people. One hundred years later, as the United States entered the 21st century, most of the population lived in the South or the West, in metropolitan areas, was female, at least 35 years old, White (but much less so), owned a home, and lived alone or in a household with one or two other people” (Hobbs and Stoops, 2002, p. 12).
The developments of interest for this book include the move from rural to metropolitan areas, the shift to the West, and the increasing racial/ethnic diversity of the American people. The implications of these trends and additional information are covered in more detail in later sections. Briefly, however, the census documents how the population became more metropolitan over the decades. From a predominantly rural nation in the 1790s, the city had come to dominate the country by the 1990s. “Metropolitanization” particularly characterized the demographic change of the United States in the twentieth century. Before World War II, the majority of Americans lived outside metropolitan territory. By the end of the century, four of every five people in the United States resided in a metropolitan area. The US population has shifted toward the South and West, and these regions dominated the last century’s population growth. Together, the West and the South increased by 471 percent during the twentieth century, compared with the combined increase of 149 percent for the Northeast and Midwest.
Population: The West
In every decade of the twentieth century and the first decade of the twenty-first century, the West’s population increased more rapidly than that of any other region. The West’s population was more than 18 times larger in 2010 than in 1900, increasing from 4 million to 73.4 million in that period (see figure 1.1; Hobbs and Stoops, 2002, p. 23; US Bureau of the Census, Population Distribution and Change, 2000–2010).
At the state level, several individual western states outpaced states in other regions and accounted for nine of the ten fastest-growing states between 1900 and 2000. In the first decade of the twenty-first century, four of the top five growth states have been in the West, with Arizona and Nevada consistently in this group.
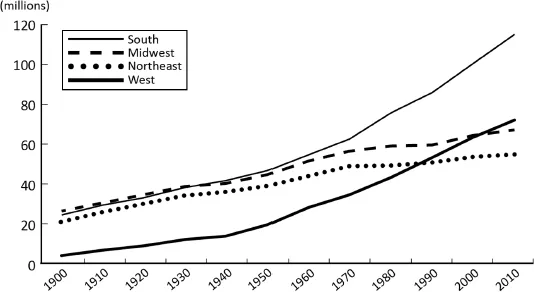
Figure 1.1 Total population by region, 1900–2010.
Source: US Bureau of the Census, Population Distribution and Change: 2000 to 2010, Table 1, p. 2.
Age: United States
Age data provide essential information in understanding the potential size and distribution of the pool of individuals entering college as traditionally aged students or as adult learners. Data since the beginning of the twentieth century document the changing age patterns in the national population (see figure 1.2).
The shift in the precollege-age portion of the population is most notable: in 1900, approximately one-third of the population was under age 14; by 2010, that proportion had dropped to about one-fifth. The members of the population aged 45–64 and those 65 and over have each increased their share of the population.
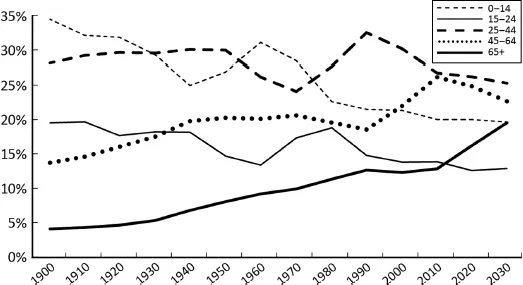
Figure 1.2 Distribution of population by age groups, US 1900–2030.
Source: Hobbs and Stoops, Demographic Trends in the 20th Century, Table 5, 2002.
As the twenty-first century progresses, the share of the nation’s youngest population, those from 0 to 24 years of age, will decline modestly. The largest decline in share will occur among those aged 45–64, as that group will move from 26 percent of the total population to 23 percent. The only increase in percentage share will be in the nation’s oldest population group; by 2030, nearly one-in-five people in the United States will be at least 65 years of age.
Age: The West
The western states also experienced significant population shifts across major age groups during the twentieth century. The age group under 15 years numbered 1.2 million in 1900, but had grown to more than 16 million by 2010. The population in the West between the ages of 16 and 64 was 2.7 million in 1900 and 48.5 million in 2010. Proportionally, the share of the population in the West under age 15 declined between 1900 and 2010 from close to 35 percent to 22 percent. That loss transferred into growth in both of the other age groups.
Projections for the western states suggest that some of the trends in age groups will continue well into this century. Numerically, all age groups will be larger in 2030 than they were in 2000 (see figure 1.3). While all age groups will grow in number, the percentage increase varies considerably. The oldest group, those aged 65 and over, is projected to see growth of 145 percent. The group projected to increase at the lowest rate is 25–44-year-olds at 23 percent.
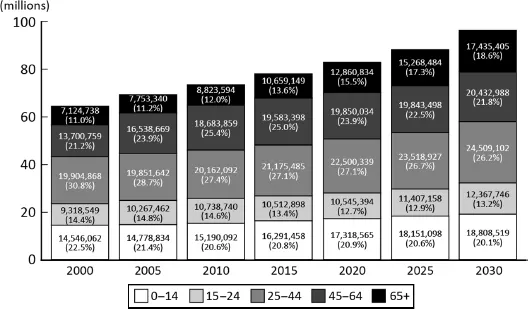
Figure 1.3 Projected numerical and percentage distribution of population by age groups, WICHE region, 2000–2030.
Source: US Census Bureau, Interim State Population Projections, 2005. File 3.
Proportionally, the West is expected to follow age trends similar to those at the national level (see figure 1.3). The youngest population group—those aged 0–14—will be a share of the population similar to the oldest group at about 20 percent, but this older group will have increased as a percentage of the total population. The largest decline will occur among those aged 25–44, as they will account for 26 percent of the population in 2030, a drop of nearly 5 percentage points from 2000.
Race/Ethnicity: United States
The phenomenal change in the racial/ethnic fabric of the United States started slowly in the early twentieth century and gained considerable momentum by mid-century. In 1900, approximately one out of ten Americans was of a race other than White; early in the twenty-first century, the ratio is approximately one out of four. Hispanic populations have experienced dramatic increases nationally and regionally. In many states, the Asian and Pacific Islander population more than tripled. The Census Bureau notes that “the vast majority of growth in the total population came from increases in those who reported their race(s) as something other than White alone and those who reported their ethnicity as Hispanic or Latino” (US Bureau of the Census, Overview of Race and Hispanic Origin, 2010, p. 3).
Until 1970, the US population was predominantly classified as either White or Black; those portions of the population that were of other races numbered fewer than three million, or approximately 1.4 percent of the population. By 2000, there were 35 million people in the United States who were of races other than White or Black (Hobbs and Stoops, 2002, p. 72). When considered collectively, minorities as a group (including all races other than White or people of Hispanic origin) grew by 88 percent between 1980 and 2000. By 2010, minorities accounted for one-third of the US population. Hawaii had become a majority minority state by 1980, when more than 50 percent of the population was minority. Among the western states, California and New Mexico had joined Hawaii by 2000.
The complexity of reporting and analyzing racial/ethnic data took a new turn with the 2000 census when, for the first time, respondents were given new options to report their racial/ethnic background. One of the more challenging options allowed respondents to self-identify as “Two or more races.” In Census 2010, 2.9 percent of respondents listed “Two or more races,” which may be any combination of the individual races, including combinations with White. The percentage of the population identifying as two or more races varies among the regions. For purposes of this chapter, data after 2000 are not comparable to earlier data due to these changes in reporting.
Race/Ethnicity: The West
Some of the regional concentrations of populations by race/ethnicity that characterized the beginning of the twentieth century changed over time, as Blacks relocated from the South to other parts of the country and Asian/Pacific Islanders moved out of the West in larger numbers, particularly to the East and Midwest. The American Indian and Alaska Native populations continued to remain predominantly in the West. Reflecting these movements, the South had the highest percentage of races other than White in every census from 1900 to 1980. The West has had the highest percentage of races other than White since 1980. In 2010, nearly 46 percent of the population in the West was minority (people who reported their ethnicity and rac...
Table of contents
- Cover
- Title
- Part I Public Policy Demographic Background
- Part II Seven Regional Public Policy Challenges
- Part III A Concluding Commentary
- Notes on Contributors
- Index
Frequently asked questions
Yes, you can cancel anytime from the Subscription tab in your account settings on the Perlego website. Your subscription will stay active until the end of your current billing period. Learn how to cancel your subscription
No, books cannot be downloaded as external files, such as PDFs, for use outside of Perlego. However, you can download books within the Perlego app for offline reading on mobile or tablet. Learn how to download books offline
Perlego offers two plans: Essential and Complete
- Essential is ideal for learners and professionals who enjoy exploring a wide range of subjects. Access the Essential Library with 800,000+ trusted titles and best-sellers across business, personal growth, and the humanities. Includes unlimited reading time and Standard Read Aloud voice.
- Complete: Perfect for advanced learners and researchers needing full, unrestricted access. Unlock 1.5M+ books across hundreds of subjects, including academic and specialized titles. The Complete Plan also includes advanced features like Premium Read Aloud and Research Assistant.
We are an online textbook subscription service, where you can get access to an entire online library for less than the price of a single book per month. With over 1.5 million books across 990+ topics, we’ve got you covered! Learn about our mission
Look out for the read-aloud symbol on your next book to see if you can listen to it. The read-aloud tool reads text aloud for you, highlighting the text as it is being read. You can pause it, speed it up and slow it down. Learn more about Read Aloud
Yes! You can use the Perlego app on both iOS and Android devices to read anytime, anywhere — even offline. Perfect for commutes or when you’re on the go.
Please note we cannot support devices running on iOS 13 and Android 7 or earlier. Learn more about using the app
Please note we cannot support devices running on iOS 13 and Android 7 or earlier. Learn more about using the app
Yes, you can access Public Policy Challenges Facing Higher Education in the American West by L. Goodchild, R. Jonsen, P. Limerick, D. Longanecker, L. Goodchild,R. Jonsen,P. Limerick,D. Longanecker in PDF and/or ePUB format, as well as other popular books in Politics & International Relations & Education Administration. We have over 1.5 million books available in our catalogue for you to explore.