
- English
- ePUB (mobile friendly)
- Available on iOS & Android
eBook - ePub
Economic Inequality and Policy Control in the United States
About this book
The income share of the top one percent of the population in the United States has increased from a little over nine percent of national income in the 1970s to 22.46 percent in 2012 a 144 percent increase. What is driving this astronomic growth in incomes for some? Is it possibly the result of non-meritorious forces? If so, how has this incredibly unequal development coexisted, and indeed worsened, in a political system based on equality?
In Economic Inequality and Policy Control in the United States, Stelzner tackles each of these questions, and, in order to further develop understanding, Stelzner looks to the past and analyzes our experience with income inequality and the orientation of laws and institutions from the Gilded Age through the New and Fair Deal. He concludes that we have the tools to tackle inequality at present the same policies we used during the New and Fair Deal. However, in order to make change durable, we have to eliminate the undemocratic elements of our political system.
Trusted by 375,005 students
Access to over 1.5 million titles for a fair monthly price.
Study more efficiently using our study tools.
Information
1
Income Inequality in the United States Today
Abstract: In the first chapter, I analyze the evolution of income inequality in the United States from the 1950s to present. I show that the share of national income going to those in the upper reaches of the income ladder has increased considerably over the last three and a half decades, and that explaining the change in top wage incomes, which predominately include non-financial sector CEO remuneration, is central to understanding these changes. I also explore SBTC—the theory for the increase in wage income inequality which, at least until recently, has the most support from economists and politicians. Finding SBTC lacking, I end the chapter in suspense.
Stelzner, Mark. Economic Inequality and Policy Control in the United States. New York: Palgrave Macmillan, 2015. DOI: 10.1057/9781137388117.0003.
Understanding American inequality
“Across the developed world,” remarked President Barak Obama in a speech in late 2013, “inequality has increased.” “[T]his increasing inequality,” continued the President, “is most pronounced in our country, and it challenges the very essence of who we are as a people.” Many have made similar statements. “We do have an issue of income inequality in America,” admitted House Speaker John Boehner in an interview with the Texas Tribune in May 2014. And Americans in general are concerned. A recent Gallup Poll found that 75 percent of all Democrats and 54 percent of all Republicans are dissatisfied with the level of income inequality in the United States. But how unequal is income inequality in the United States? And for how long and by how much has it increased?
Answering these questions in detail is the first step toward understanding American inequality. However, one must also ask other questions. For example, what is driving the astronomic growth in incomes for some? Is it the result of an increase in the social worth of certain individuals relative to the rest? Such an understanding is important because it justifies extreme inequality in outcome in a political system based on equality. Past and present, many have argued that this is the case. “[W]hile the law [of competition] may be sometimes hard for the individual, it is best for the race,” asserted Andrew Carnegie in the beginning of the twentieth century.1 “I believe in a merit nation, an opportunity nation where people by virtue of their education, their hard work and risk taking and their dreams—may be a little luck,” explained presidential candidate Mitt Romney at a rally in Florida in 2012, can “achieve great things.” From such an understanding, there is a strong case for eliminating or severely circumscribing government intervention in labor markets. And one can easily take the next logical step, as financier Russell Sage, and claim that “to rail against the accumulation of wealth is to rail against the decrees of justice,” or describe negative talk about our current level of income inequality, as Romney and many other have, as just “envy.”2
Although ideas like those held by Romney and Carnegie command a lot of attention, there are other explanations for the dramatic rise in inequality over the last three and a half decades. Some argue the relative growth in incomes for some is the result of change in the orientation of laws and institutions, which gives certain individuals the ability to increase their remuneration at the expense of others. “The game right now in America is rigged,” commented Massachusetts Senator Elizabeth Warren in 2014. “It is rigged so that those at the top keep doing better and better, and everyone else is under increasing pressure, is under increasing economic strain.”3 Others have made similar statements. “There’s class warfare, all right,” remarked Warren Buffet, chief executive of Berkshire Hathaway, in response to the cacophony of televised commentary about government intervention. “[B]ut it’s my class, the rich class, that’s making war,” continued Buffet, “and we’re winning.”4 Such an understanding would lead to a dramatically different political response than if changing social worth explains inequality and would open up questions about how these developments are possible in a democracy.
To deepen our understanding and better answer the question above, it is important to look into the past and analyze the long-term trends in income inequality in the United States. There is much talk at present about how our current experience with income inequality is similar to the Gilded Age.5 Indeed, many of our Gilded Age counterparts made comments similar to those of Elizabeth Warren and Warren Buffet. “Our government has been for the past few years under the control of heads of great allied corporations with special interests,” asserted Woodrow Wilson of the late nineteenth and early twentieth centuries. “[I]t has submitted itself to their control. As a result, there have grown up vicious systems and schemes of governmental favoritism . . . far reaching in effect upon the whole fabric of life.”6 But exactly how does the Gilded Age compare to the present? And what can we learn from it? Furthermore, it is important to look at other periods in US history like the Progressive Era, the New Age, and the years of the New Deal and the Fair Deal.7 How did income inequality evolve during these periods and what drove these changes?
In this book, we will explore these topics in greater depth. Chapter by chapter, we will pick up each of these questions to build our understanding of American income inequality. And, in the end, we will hopefully leave with a better understanding of how our economic and political systems have worked in the past and present and how to address problems we face today. But, before we can get to these deeper issues, we have to examine the evolution of US income inequality over the last three and a half decades and explore some explanations for its increase. To this we now turn.
Our current experience
Using income tax data, we can organize the adult population of the United States based on each individual’s total yearly earnings from all sources (wages, bonuses, dividends, interest, capital gains, etc.), with the individual receiving the lowest remuneration on the far left, the individual earning the most on far right, and each individual in between arranged such that earnings descend steadily from right to left. We can then take the top 10 percent of the population, the 10 percent of the population lined up on the far right, and track its total income as a percentage of national income. In Figure 1.1, I display this data for the 1950s through 2012.8 As we can see, the United States went from a relative low level of income inequality during the three decades following the World War II to an extremely high level at present.
From the 1950s through the 1970s, the share of total income accruing to the top 10 percent of all adults stayed between 32 and 36 percent. What does this mean? Roughly, one out of every three dollars generated by the economic activities of all US citizens accrued to the top 10 percent of the population. The remaining two out of every three dollars went to the rest of the population (the bottom 90 percent). This was a relatively equal distribution, and it remained more or less that way in the three decades following World War II. Thus, John F. Kennedy could rightly say in 1963 that “a rising tide lifts all boats.” The large growth in national income between the 1950s and the 1970s benefited income groups equally, with the average yearly income for the bottom 90 percent of the population keeping pace with productivity growth increasing from less than $20,000 in 1950 to almost $35,000 in the late 1970s.9
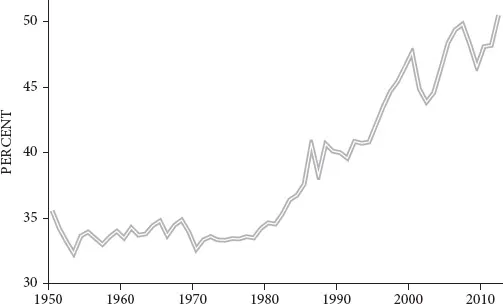
FIGURE 1.1 Income share of top 10 percent in the United States
Source: Piketty, Thomas and Saez, Emmanuel (2003), “Income Inequality in the United States, 1913–1998,” The Quarterly Journal of Economics, Vol. 118, No. 1, pp. 1–39.
This changed in the 1980s. Income inequality began to increase rapidly during the decade of Ronald Regan and George Bush Senior, and, except for short-term fluctuations, has continued to increase since. By the end of the 1980s, the income share of the top 10 percent had increased by more than 6 percentage points from its value in 1979. In 1988, it reached 40.63 percent of all income. This increase meant that slightly more than four out of every ten dollars generated by economic activity in the United States accrued to the top 10 percent of the population, leaving less than six out of every ten dollars for the bottom 90 percent of the population. However, it did not stop there. By the late 1990s, the income share of the top 10 percent surpassed 45 percent. And in 2012, the last year for which we have data, the top 10 percent of the population earned an equivalent of 50.42 percent of the national income. More than half of all income generated by US citizens went to the top 10 percent in 2012, and less than half was left for the bottom 90 percent of the population.
Income inequality has increased so rapidly over the last three decades that Kennedy’s heartwarming metaphor is no longer true. Despite average yearly growth in output per worker of around 2 percent in the United States, the average real income of the bottom 90 percent of the US population has stagnated. In 1979, the average yearly income of the bottom 90 percent was almost $34,000. Since then, the average income of the bottom 90 percent has fluctuated between $30,000 and $37,000. However, the average over the entire period is barely more than $33,000. Indeed, during the first three years of the current decade, the average income of the bottom 90 percent was less still—barely surpassing $31,000. Income growth in the United States since the 1980s has exclusively benefited the top 10 percent of the population.
These outcomes are incredible. Indeed, the income share of the top 10 percent of the population in 2012 is the highest we have on record in the United States. In 1917, the first year we have data for this group, the income share of the top 10 percent represented 40.51 percent of the national income. During the 1920s, the share of total income accruing to the top 10 percent increased rapidly. However, by 1928, the climax of the roaring twenties, it had only reached 49.29 percent of total income—more than a percentage point less than in 2012.
A peculiar characteristic of the current increase in income inequality in the United States is that it was driven by an increase in inequality among wage incomes. What does this mean? Income can be separated into two groups: wage and capital income. Wage income comes from working and takes the form of wages, salaries, bonuses, and other payments to employees. This category includes every kind of worker, from janitors and secretaries, to managers and chief financial officers (CFOs). Capital income comes from owning financial and real assets, and takes the form of profits, dividends, interest, rents, capital gains, loyalties, and any other income stream from the ownership of an asset. The increase in the income share of the top 10 percent from between 33 and 35 percent in the late 1970s to more than 50 percent in 2012 is the result of an increase in both inequality of financial and real estate ownership and thus an increase in inequality from capital incomes, as well as an increase in inequality of wages. However, inequality of wages accounts for approximately two-thirds of the increase of the top 10 percent’s share in total income over the last three and a half decades.
Skill biased technological change?
Explaining these dramatic increases in income inequality in the United States has become a hot topic in the media, in political circles, and among academics. The explanation that has received the most support from economists and politicians, at least until recently, is skill biased technological change (SBTC). The story goes as follows: since the 1980s, technological change has been concentrated in capital goods utilized by skilled workers.10 A common example of this type of technological change is the computer and the Internet. Utilization of these technologies requires a high skill level. Thus the increase in productivity from computers, the Internet, and other similar technologies is exclusively captured by high skilled workers. As a result, business has increased its demand for high skilled workers, and because the supply of high skilled...
Table of contents
- Cover
- Title
- 1 Income Inequality in the United States Today
- 2 Changing the Rules of the Game
- 3 The Gilded Age, the Progressive Era, and the New Era
- 4 Mixed Results
- 5 Cycles of Policy Control
- 6 How Do We Fix It?
- Bibliography
- Index
Frequently asked questions
Yes, you can cancel anytime from the Subscription tab in your account settings on the Perlego website. Your subscription will stay active until the end of your current billing period. Learn how to cancel your subscription
No, books cannot be downloaded as external files, such as PDFs, for use outside of Perlego. However, you can download books within the Perlego app for offline reading on mobile or tablet. Learn how to download books offline
Perlego offers two plans: Essential and Complete
- Essential is ideal for learners and professionals who enjoy exploring a wide range of subjects. Access the Essential Library with 800,000+ trusted titles and best-sellers across business, personal growth, and the humanities. Includes unlimited reading time and Standard Read Aloud voice.
- Complete: Perfect for advanced learners and researchers needing full, unrestricted access. Unlock 1.5M+ books across hundreds of subjects, including academic and specialized titles. The Complete Plan also includes advanced features like Premium Read Aloud and Research Assistant.
We are an online textbook subscription service, where you can get access to an entire online library for less than the price of a single book per month. With over 1.5 million books across 990+ topics, we’ve got you covered! Learn about our mission
Look out for the read-aloud symbol on your next book to see if you can listen to it. The read-aloud tool reads text aloud for you, highlighting the text as it is being read. You can pause it, speed it up and slow it down. Learn more about Read Aloud
Yes! You can use the Perlego app on both iOS and Android devices to read anytime, anywhere — even offline. Perfect for commutes or when you’re on the go.
Please note we cannot support devices running on iOS 13 and Android 7 or earlier. Learn more about using the app
Please note we cannot support devices running on iOS 13 and Android 7 or earlier. Learn more about using the app
Yes, you can access Economic Inequality and Policy Control in the United States by M. Stelzner in PDF and/or ePUB format, as well as other popular books in Economics & Economic History. We have over 1.5 million books available in our catalogue for you to explore.