It would be an odd economics book indeed that didn’t cover the core economic concepts. The applicability of this one to real markets does not make it an exception. Indeed, we must know what we are applying before it can be applied! That is not to say a laboured treatment of each concept lies ahead. By choosing a book about economics and markets, you have identified yourself as someone smart, even if you’ve never decided to study such things before. So I shall not insult you by pretending you need transferable concepts reintroduced from scratch each time. Nor will I provide repetitive derivations and “proofs” here, especially as the latter are rarely of useful things. Much better to move quickly enough that the linkages between concepts flow. This book’s unrepentant focus will be on what you need to know to form a robust framework that is genuinely applicable to real markets. As the useful stuff includes the exceptions that arise outside dodgy assumptions, some of it might come as a surprise even to students of economics.
The foundations for our framework are in the fundamental truths of human action. It is by the self-interested actions of individuals that effective demands and production follows. Monitoring this is a problem that forces us to rely on aggregate data, despite the dangers of doing so, which are ignored all too frequently. We will review the relevance and interrelationships of the national accounts data here. As real growth ultimately just boils down to productivity and labour supply, we will focus on those concepts and some of the associated forecasting basics. As is often optimal and logical, we do this in volume terms first. Growth in the value of expenditure associated with rising prices is usually of less relevance. Nonetheless, as prices do not change uniformly, there will be relative winners and losers from price movements. The cause of them is crucial, with one-off shocks, shifts in inflation expectations and cyclical capacity pressures carrying different conclusions. Despite the centrality of the latter to this and many other core economic questions, mainstream models represent the nature of the business cycle poorly. Fortunately, the adoption of more realistic assumptions opens up explanations. Having to deal with complex dynamics is the price we pay for this, and yet that is also the point because complexity is at the heart of real markets.
At its heart, economics is about human action. It is the rational self-interest of individuals that ultimately determines the allocation of resources. Rationality is not to say that people always make the right decision or even that they seek to maximise profits. People are fallible and crave things other than profit, so charitable behaviour can still be rational even if it is not necessarily financially optimal. This perspective may challenge some fundamental theories, but it is not an insurmountable problem. It is warts and all outcomes of individual decisions that determine what the economy does. Complexity abounds as a result, but that is the beauty of it all.
Large corporations are sometimes branded as better matching the modern economic structure. This perspective has some truth from the production perspective nowadays, but there are still fallible individuals at the helm with foibles that are crucial to understanding corporate behaviours. Companies of all sizes are in any case aiming to fulfil the demands of their individual consumers profitably. If the next generation iPhone were just an old Nokia 3210, even devout fans of the brand would desert the company for a competitor. No amount of marketing would change that, contrary to the apparent view of some anti-capitalists who see people as pathetically gullible.
This chapter starts from this grounding of economics in human actions and formalises a framework for how we might determine effective demands. This approach treats people as trying to maximise the personal value they can get from their money . Or put in more mathematical terms, that means maximising utility subject to a budget constraint. Once the demand decision and some quirky cases are cleared up, there will be an exploration of the production side of the economy. Knowing the theoretical basics of how companies set prices and stay solvent can be invaluable for understanding how real markets will move. Addressing some market imperfections will provide an additional level of useful depth. Finally, this chapter will cover how the aggregate level of activity is measured and how balance sheet positions accumulate as a result of it.
1.1 Demand
No one wants for nothing. In fact, we might describe humanity more reasonably as having unlimited wants and limited resources. Economics is ultimately about the allocation of those resources. Microeconomists naturally spend a lot of time debating how those demands lead to trade-offs. At a more macrolevel, though, these observed behaviours influence how businesses seek to set their prices and anticipate how changes in relative prices and incomes might impact their sales by extension.
1.1.1 Indifference Curves
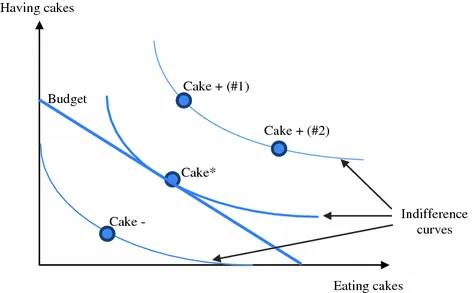
Everyone has their personal intrinsic values and preferences that determine their demands. In its simplest form, we can view this as a
trade-off between two things, like having cakes and eating them, as shown by the “
indifference curves ” in Fig.
1.1. As with most things, there is not a linear relationship here. The value of eating more cakes falls the more you’ve eaten—you’ll start to get full—with the value of having the cake for later going up instead. Or vice versa, eating cake when you’re holding a mountain of them will be more tempting.
For a given set of preferences, someone might be indifferent between points #1 and #2 on the Cake+ line. Either position gives the person far more cake to both have and eat than any point on the Cake- line, so they’d rather have that option if it exists. In general, an economist would say that higher indifference curves are always preferred to lower ones, which is important when we remember that there is always a constraint. The point where the highest indifference curve touches the budget constraint maximises utility (i.e. Cake*). That’s the tasty point where you are eating exactly the right proportion of the cakes you have.
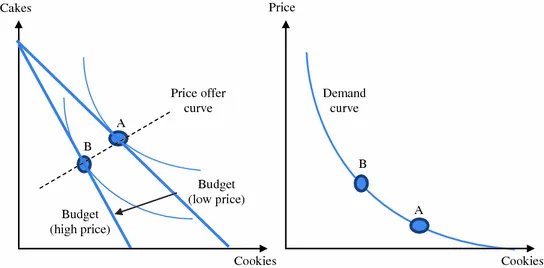
The previous example is a theoretical snapshot rather than something to directly observe and exploit. As prices and income changes, preferences can shift this snapshot. What business can do is vary their prices, which effectively pivots the budget constraint line, as shown in the cakes and cookies
trade-off of Fig.
1.2. By observing what happens to the
demand for cookies as its price changes, a
demand curve can be built up. By extension, from changing relative prices, the marginal rate of substation between products can also be estimated. Shifts to online shopping portals are lowering the costs and difficulties of changing prices and running such experiments. And as incomes evolve over time, or as we observe behaviours between different consumer groups, the variation of relative
demand to income can also be derived (dubbed an Engel curve when plotted). In most cases, we would expect higher prices to discourage purchases in favour of something else, while higher incomes would normally raise
demand .
1.1.2 The Special Ones
There are some special cases where the usual rules don’t apply. A simple example is that of a perfect substitute, where a small difference in price can capture all demand when it becomes more competitive. If the price change doesn’t stop it being the cheapest or dearest, then there isn’t an effect on demand . With online platforms increasingly making identical listings from multiple indistinguishable third-party sellers, this is not as rare an occurrence as it might sound. Nor is it just a phenomenon for goods since services like hotels are increasingly becoming commoditised through listings on price comparison websites.
Another special class to consider is that of so-called Giffen goods , which face falling demand as their prices fall and vice versa. They are an extreme example of “necessary goods”, where demand changes by less than income. In this extreme, though, when the price of something fundamental and unavoidable for survival rises, people end up with less to spend on other things and so have to buy even more of the good, despite its higher price. That may sound implausible in modern developed countries, but was pertinent during the Irish potato famine and remains so for rice in poorer parts of Asia. Meanwhile, the less extreme example of demand rising less than incomes is an everyday occurrence and core to understanding what the retail industry commonly calls non-discretionary consumption.
1.2 Production
Firms need to understand their current and potential customers demands in order to anticipate what to produce profitably. Turning that into a viable production plan is more than just a demand curve, though. Prices and volumes of potential sales need to be weighed against the costs of producing different volumes. Moreover, in a competitive market, various types of costs count differently towards the optimal production strategy over different horizons, so there are some significant differences to explore.
1.2.1 Costs
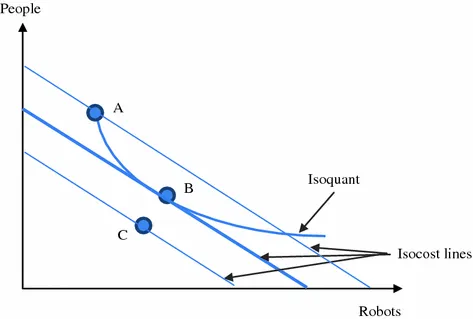
It is rare for restrictions to limit a company to only one production option . Different inputs from various producers will cost different amounts at different volumes, so there is a task in itself to find what combination minimises costs. This job amounts to a similar problem as the consumer’s demand decision. Difficulty in substituting too heavily away from some inputs creates a nonlinear “isoquant” curve covering the resources needed for a given level of production. Meanwhile, the cost of various input combinations is linear, like the budget constraint in the earlier discussion about demand decisions.
A company could use the mixture at point “A” in Fig.
1.3, but it could also use combination “B”, which would cost it less. Combination “C” would be cheaper still but isn’t a viable way of producing the desired amount. In general, the lowest Isocost line that touches the isoquant is optimal, exactly as the highest indifference curve for a budget constraint was. That no doubt sounds horribly abstract, but if you know your potential suppliers and production processes, it is a point that can be calculated, with costs minimised for a given level of output as a result.
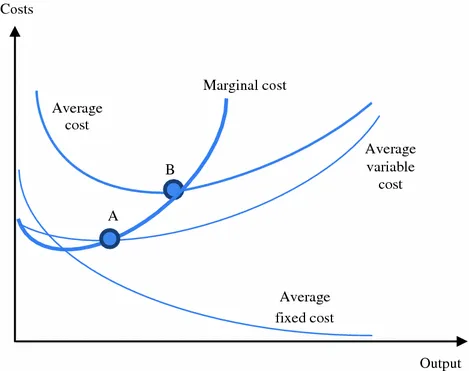
In the previous example, we looked at what combination of inputs delivers a level of production, which is essentially the variable cost of output. Specifically, variable costs are those costs that increase with production. Such costs are related to marginal costs, but whereas the average variable cost is an average of such costs across all output, the marginal cost is only for the production of an additional unit. When a company can enjoy economies of scale—i.e. an additional unit is cheaper than the last—marginal costs are by definition below average variable costs. When inefficiencies dominate, causing diseconomies of scale, the marginal costs will be above instead. That inflexion point is “A” in Fig.
1.4.
There is another class of costs that do not vary with production. They are instead fixed, at least in the short term, and these also influence the optimal level of production. As output increases, fixed costs spread out more, and so the average fixed cost level will fall. A company’s actual average costs are a combination of both the average variable and fixed costs. Because of the benefit that comes from spreading fixed costs out further, overall average costs are minimised at a higher level of output than average variable costs (i.e. “B” in Fig. 1.4).
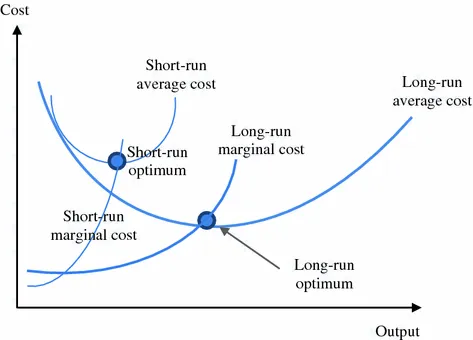
In the long run, companies can vary a variety of short-term fixed things. Contracts might prevent redundancies, changing offices or switching to another supplier. After a change has occurred, the company may be tied in again for some period, and it will face a new short-run average cost curve. As a business would always choose to face the most favourable fixed cost environment in the long run, we can depict the long-run average cost curve as hugging the bottom of all the potential short-run ones, as in Fig.
1.5. Because of this, the optimum level for minimising average costs will differ between the short run and long run.
1.2.2 Marginals Matter
There is an adage in business that “cost control will keep you whole”, but that is only one side of the balance. Companies also need sales. The price achieved in each transaction is the company’s marginal revenue on it, and it will be profitable to keep making sales until that marginal revenue is equal to the marginal cost of production. Sell less than that and the company is missing out on some profit, sell more and it is making some of those sales at a loss. For a business in a competitive market where it has little influence on the market price, this means it needs to produce the level of output where its marginal cost of production is equal to the market price. That is where its profits will be maximised, at least in the short run, provided that the price level is above the average variable cost level.
Fixed costs may...
