![]()
A/B SPLIT TESTING
Introduction
A/B split testing is a simple yet effective method of quantifying the effect of a single variable or factor on performance or output. Sometimes referred to as ‘split run testing’, the split test technique is used widely in direct marketing, web-based landing-page conversion rates, printed advertisements, product testing in supermarkets and in more general process improvement.
Key Features
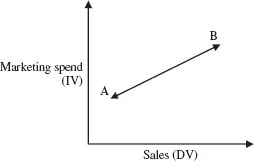
Split testing enables us to measure the effects of a single independent variable (IV) over which we can exert control on a dependent variable (DV) such as total sales, website hits, product returns, etc. It is essential for the sake of validity that all other variables remain controlled in order to be confident that the output phenomenon is attributable to the input variable. As a convention (though not necessarily), variables are reduced to factors at two levels – e.g. marketing spend at Level A (£10,000) and Level B (£20,000) – see Figure 1.
It is possible to conduct a series of consecutive split tests which assess the effects of adjusting different independent variables; however, it is not possible to conclude any results of the interactive relationship of these input variables with simple A/B split testing. In general, split testing is best used where the number of potential input variables is kept to a minimum.
Application
Result tracking is essential to measure the performance of each trial condition respectively. In marketing, determination between samples can be achieved by means of setting and retrieving an electronic cookie, destination URL visited, phone number called, coupon code used or a serial number. It is important that split tests are administered simultaneously and to the same population (stratified samples in some cases) to eliminate the effects of confounding factors such as seasonal variances or other temporary influences.
For example, split tests are sometimes used to compare the conversion rates of one ad copy over another in which many factors may vary. Whereas this will demonstrate the results on the dependent variable (e.g. actual sales) very effectively, it would be erroneous to infer much about the effects of the interaction of factors in either sample. In this regard, it is a highly effective tool for selection based on performance but of little use in informing the manager about the value of certain factors or the relationship between them. This inability to model the nature of the relationships make A/B split testing a poor predictor of performance but still a very useful means of comparison of samples that can be used iteratively to improve performance, challenge assumptions and refine ‘expert’ opinion through incremental changes.
Figure 1 A positive linear effect of the IV on the DV
Two variations of split test
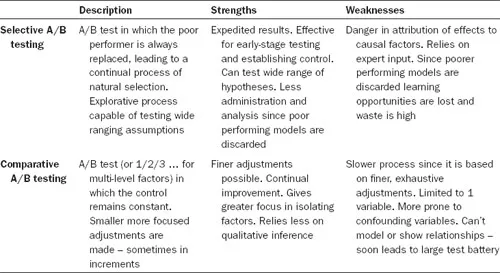
Although the distinction is never made, and because split testing is an informal quantitative method, split tests can be applied on the micro or macro level. Two applications of the split test are featured in Table 1 below.
Example Methodology
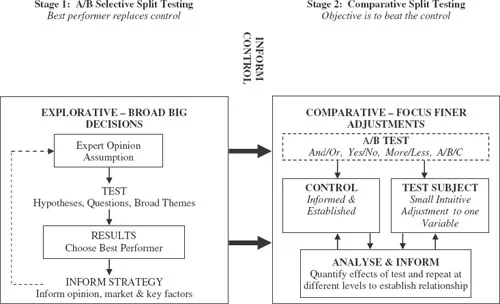
These two applications of split testing (as outlined in Table 1) can be incorporated into an experimental methodology. This is achieved as a consecutive series of tests in which expert assumptions are tested as hypotheses and the results considered to further narrow the search in subsequent tests. In this regard, split testing can be used exploratively to feel out broader assumptions – the results of which can be used to gradually narrow the focus of the tests. For example, in marketing, initial tests might compare radically different advertisement copies to question the market in terms of respective Return on Investment (ROI). Once the results of initial studies have been determined, subsequent testing could seek to refine the focus further and optimize the effectiveness of the copy on a one-factor-at-a-time basis. Figure 2 outlines a potential experimental methodology in which selective split testing is first used to rapidly explore the larger themes of expert assumption, paring down options to produce an initial control that performs at an acceptable level and is born of some evidence. This control is then refined using comparative split testing method in which the effects of factors on output/performance can be tested more closely and towards a finer effect.
Table 1 Two applications of split tests
Figure 2 A split testing methodology towards best performance
Validity
Providing split tests are only performed on a single variable or factor to similarly sized random or stratified samples from the same target population they can be said to have a fair degree of internal validity. This is especially true where analysis is used to test the degree that the observed results deviated from those expected under the null hypothesis to an appropriate confidence interval. However, the role of confounding factors can never be truly ruled out in the observation of complex phenomena such as customer buying habit. It is important to note that the continual refinement of the hypothesis is the cyclical nature of split tests, since performance outcome is the goal and not validity through a demonstrable causal relationship.
Split tests, by their nature, lack any external validity as the results are always peculiar to the individual phenomena under observation/refinement and are not therefore intended to produce results that can be generalized to other systems.
Analysis
The results of A/B split tests do not require much analysis. Providing significantly large samples of an equal size have undergone each trial condition, then a count of the results or outcome on the dependent variable needs only be tallied and compared using a contingency table and the χ2 test for independence.
The χ2 (chi square) test is able to calculate whether the respective performance results of each test condition (i.e. the A/B conditions) are significantly different enough for us to conclude that we should consider replacing our control (i.e. our A) with our challenger (B).
Since the null hypothesis states that we expect no difference between the results of each test, we are able to compare the results we actually observed with the results we might have expected if the null hypothesis were fully true and there had been no difference at all between A and B. The χ2 test is able to present this observed difference between tests A and B as a probability value to indicate the degree to which we can put this difference down to chance and to what degree we can be confident that the difference is down to us having identified (and manipulated) a controlling variable.
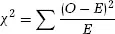
The chi square formula
(NB: the χ2value is the sum of the squared difference between the observed and expected values divided by the expected value for each condition. This simple statistical test can be performed by all major statistical software packages.)
Conclusion
Split tests have the advantage of rapid implementation with short-term results that enable the manager to ask questions of the target group and for testing grander themes in hypotheses. This has the benefit of effectively surveying live activity and determining factors that produce more of our desired result. However it is essential that the manager understand that only one such question can be asked at any one time for valid results. It is also important to note, that if it is suspected that there are a greater number of factors directly influencing performance (or that some factors are having a greater effect than others) then the possible number of combinations for split testing (i.e. the full factoral array) will soon run into prohibitively large numbers of required tests, in which case a multivariate method should be used.
Further Reading
Alt, B. and Usborne, N. (2006) ‘The power of small changes tested’, in F. McGlaughlin (ed.), Marketing Experiments Journal. [Online] March 21. http://www.marketingexperiments.com/improving-website-conversion/power-small-change.html.
Chatham, B., Temkin, B.D. and Amato, M.A. (2004) Primer on A/B Testing. Forrester Research.
Eisenberg, B. (2005) How to Improve A/B Testing. ClickZ Network. [Online] April 29. http://www.clickz.com/showPage.html?page=3500811
Eisenberg, B. and Eisenberg, J. (2005) Call to Action, Secret Formulas to Improve Online Results. Making the Dial Move by Testing, Introducing A/B Testing. Wizard Academy Press.
Ledolter, J. and Swersey, A. (2007) Testing 1 – 2 – 3: Experimental Design with Applications in Marketing and Service Operations. Stanford University Press.
Glyn Winter
![]()
ANALYTIC HIERARCHY PROCESS
Introduction
The Analytic Hierarchy Process (AHP), introduced by T.L. Saaty, is a well-known and popular method of multicriteria decision support (Saaty, 1977, 1980). As an aid to multicriteria decision making (MCDM), it produces a series of priority values used to preference rank a group of alternatives, based on pairwise comparisons of criteria and alternatives (over the different criteria). Its application in management research includes transport planning (Saaty, 1995).
The main directions of development of the original AHP include fuzzy versions (Zhu et al., 1999), interval versions (Haines, 1998) and Monte Carlo simulation versions (Carmone et al., 1997). As a popular technique, it is not without its criticism, with a number of concerns highlighted on its operation, including the scale values used and priority value construction process (Saaty, 1994; Beynon, 2002). Further diverse...