Mastering Machine Learning with Spark 2.x
eBook - ePub

Mastering Machine Learning with Spark 2.x

  1. 323 pages
  2. English
  3. ePUB (mobile friendly)
  4. Available on iOS & Android
eBook - ePub

Mastering Machine Learning with Spark 2.x

Book details
Book preview
Table of contents
Citations

About This Book

Unlock the complexities of machine learning algorithms in Spark to generate useful data insights through this data analysis tutorialAbout This Bookā€¢ Process and analyze big data in a distributed and scalable wayā€¢ Write sophisticated Spark pipelines that incorporate elaborate extractionā€¢ Build and use regression models to predict flight delays Who This Book Is ForAre you a developer with a background in machine learning and statistics who is feeling limited by the current slow and "small data" machine learning tools? Then this is the book for you! In this book, you will create scalable machine learning applications to power a modern data-driven business using Spark. We assume that you already know the machine learning concepts and algorithms and have Spark up and running (whether on a cluster or locally) and have a basic knowledge of the various libraries contained in Spark.What You Will Learnā€¢ Use Spark streams to cluster tweets onlineā€¢ Run the PageRank algorithm to compute user influenceā€¢ Perform complex manipulation of DataFrames using Sparkā€¢ Define Spark pipelines to compose individual data transformationsā€¢ Utilize generated models for off-line/on-line predictionā€¢ Transfer the learning from an ensemble to a simpler Neural Networkā€¢ Understand basic graph properties and important graph operationsā€¢ Use GraphFrames, an extension of DataFrames to graphs, to study graphs using an elegant query languageā€¢ Use K-means algorithm to cluster movie reviews datasetIn DetailThe purpose of machine learning is to build systems that learn from data. Being able to understand trends and patterns in complex data is critical to success; it is one of the key strategies to unlock growth in the challenging contemporary marketplace today. With the meteoric rise of machine learning, developers are now keen on finding out how can they make their Spark applications smarter.This book gives you access to transform data into actionable knowledge. The book commences by defining machine learning primitives by the MLlib and H2O libraries. You will learn how to use Binary classification to detect the Higgs Boson particle in the huge amount of data produced by CERN particle collider and classify daily health activities using ensemble Methods for Multi-Class Classification.Next, you will solve a typical regression problem involving flight delay predictions and write sophisticated Spark pipelines. You will analyze Twitter data with help of the doc2vec algorithm and K-means clustering. Finally, you will build different pattern mining models using MLlib, perform complex manipulation of DataFrames using Spark and Spark SQL, and deploy your app in a Spark streaming environment.Style and approachThis book takes a practical approach to help you get to grips with using Spark for analytics and to implement machine learning algorithms. We'll teach you about advanced applications of machine learning through illustrative examples. These examples will equip you to harness the potential of machine learning, through Spark, in a variety of enterprise-grade systems.

Frequently asked questions

Simply head over to the account section in settings and click on ā€œCancel Subscriptionā€ - itā€™s as simple as that. After you cancel, your membership will stay active for the remainder of the time youā€™ve paid for. Learn more here.
At the moment all of our mobile-responsive ePub books are available to download via the app. Most of our PDFs are also available to download and we're working on making the final remaining ones downloadable now. Learn more here.
Both plans give you full access to the library and all of Perlegoā€™s features. The only differences are the price and subscription period: With the annual plan youā€™ll save around 30% compared to 12 months on the monthly plan.
We are an online textbook subscription service, where you can get access to an entire online library for less than the price of a single book per month. With over 1 million books across 1000+ topics, weā€™ve got you covered! Learn more here.
Look out for the read-aloud symbol on your next book to see if you can listen to it. The read-aloud tool reads text aloud for you, highlighting the text as it is being read. You can pause it, speed it up and slow it down. Learn more here.
Yes, you can access Mastering Machine Learning with Spark 2.x by Alex Tellez, Max Pumperla, Michal Malohlava in PDF and/or ePUB format, as well as other popular books in Computer Science & Data Processing. We have over one million books available in our catalogue for you to explore.

Information

Year
2017
ISBN
9781785282416
Edition
1

Graph Analytics with GraphX

In our interconnected world, graphs are omnipresent. The World Wide Web (WWW) is just one example of a complex structure that we can consider a graph, in which web pages represent entities that are connected by incoming and outgoing links between them. In Facebookā€™s social graph, many millions of users form a network, connecting friends around the globe. Many other important structures that we see and can collect data for today come equipped with a natural graph structure; that is, they can, at a very basic level, be understood as a collection of vertices that are connected to each other in a certain way by what we call edges. Stated in this generality, this observation reflects how ubiquitous graphs are. What makes it valuable is that the graphs are well-studied structures and that there are many algorithms available that allow us to gain important insights about what these graphs represent.
Sparkā€™s GraphX library is a natural entry point to study graphs at scale. Leveraging RDDs from the Spark core to encode vertices and edges, we can do graph analytics on vast amounts of data with GraphX. To give an overview, you will learn about the following topics in this chapter:
  • Basic graph properties and important graph operations
  • How GraphX represents property graphs and how to work with them
  • Loading graph data in various ways and generating synthetic graph data to experiment with
  • Essential graph properties by using GraphXā€™s core engine
  • Visualizing graphs with an open source tool called Gephi
  • Implementing efficient graph-parallel algorithms using two of GraphXā€™s key APIs.
  • Using GraphFrames, an extension of DataFrames to graphs, and studying graphs using an elegant query language
  • Running important graph algorithms available in GraphX on a social graph, consisting of retweets and a graph of actors appearing in movies together

Basic graph theory

Before diving into Spark GraphX and its applications, we will first define graphs on a basic level and explain what properties they may come with and what structures are worth studying in our context. Along the way of introducing these properties, we will give more concrete examples of graphs that we consider in everyday life.

Graphs

To formalize the notion of a graph briefly sketched in the introduction, on a purely mathematical level, a graph G = (V, E) can be described as a pair of vertices V and edges E, as follows:
V = {v1, ..., vn}
E = {e1, ..., em}
We call the element vi in V a vertex and ei in E an edge, where each edge connecting two vertices v1 and v2 is, in fact, just a pair of vertices, that is, ei = (v1, v2). Let's construct a simple graph consisting of five vertices and six edges, as specified by the following graph data:
V ={v1, v2, v3, v4, v5}
E = {e1 = (v1, v2), e2 = (v1, v3), e3 = (v2, v3),
e4 = (v3, v4), e5 = (v4, v1), e6 = (v4, v5)}
This is what the graph will look like:
Figure 1: A simple undirected graph with five vertices and six edges
Note that in the realization of the graph in Figure 1, the relative position of nodes to each other, the length of the edges, and other visual properties are inessential to the graph. In fact, we could have displayed the graph in any other way by means of deforming it. The graph definition entirely determines its topology.

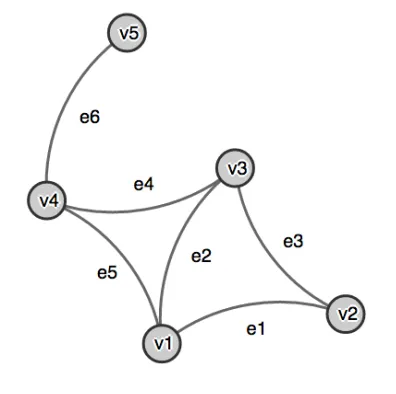
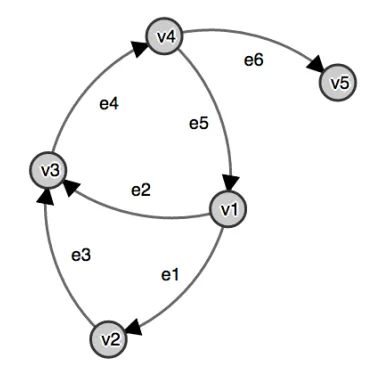
Directed and undirected graphs

In a pair of vertices that make up an edge e, by convention, we call the first vertex the source and the second one the target. The natural interpretation here is that the connection represented by edge e has a direction; it flows from the source to the target. Note that in Figure 1, the graph displayed is undirected; that is, we did not distinguish between the source and target.
Using the exact same definition, we can create a directed version of our graph, as shown in the following image. Note that the graph looks slightly different in the way it is presented, but the connections of vertices and edges remain unchanged:
Figure 2: A directed graph with the same topology as the previous one. In fact, forgetting edge directions would yield the same graph as in Figure 1
Each directed graph naturally has an associated undirected graph, realized by simply forgetting all the edge directions. From a practical perspective, most implementations of graphs inherently build on directed edges and suppress the additional information of direction whenever needed. To give an example, think of the preceding graph as a group of five people connected by the relationship, friendship. We may argue that friendship is a symmetric property in that if you are a friend of mine, I am also a friend of yours. With this interpretation, directionality is not a very useful concept in this example, so we are, in fact, better off to treat this as an undirected graph example. In contrast, if we were to run a social network that allows users to actively send friend requests to other users, a directed graph might be better to encode this information.

Order and degree

For any graph, directed or not, we can read off some basic properties that are of interest later in the chapter. We call the number of vertices |V| the order of the graph and the number of edges |E| its degree, sometimes also referred to as its valency. The degree of a vertex is the number of edges that have this vertex as either source or target. In the case of directed graphs and a given vertex v, we can additionally distinguish between in-degree, that is, the sum of all the edges pointing towards v, and out-degree, that is, the sum of all the edges starting at v. To give an example of this, the undirected graph in Figure 1 has order 5 and degree 6, same as the directed graph shown in Figure 2. In the latter, vertex v1 has out-degree 2 and in-degree 1, while v5 has out-degree 0 and in-degree 1.
In the last two examples, we annotated the vertices and edges with their respective identifiers, as specified by the definition G = (V, E). For most graph visualizations that follow, we will assume that the identity of vertices and edges is implicitly known and will instead represent them by labeling our graphs with additional information. The reason we make this explicit distinction between identifiers and labels is that GraphX identifiers canā€™t be strings, as we will see in the next section. An example of a labeled graph with relationships of a group of people is shown in the following diagram:
Figure 3: A directed labelled graph showing a group of people and their relationships

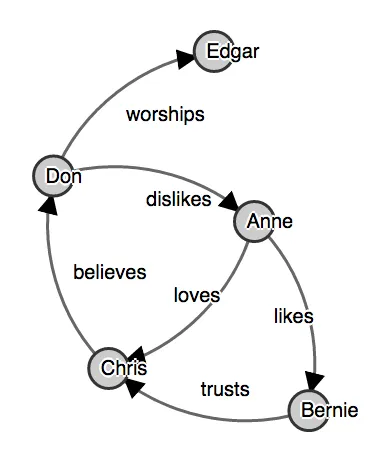
Directed acyclic graphs

The next notion we want to discuss is that of acyclicity. A cyclic graph is one in which there is at least one vertex for which there is a path through the graph, connecting this vertex to itself. We call such a path a cycle. In an undirected graph, any chain creating a cycle will do, while in a directed graph, we o...

Table of contents

  1. Title Page
  2. Copyright
  3. Credits
  4. About the Authors
  5. About the Reviewer
  6. www.PacktPub.com
  7. Customer Feedback
  8. Preface
  9. Introduction to Large-Scale Machine Learning and Spark
  10. Detecting Dark Matter - The Higgs-Boson Particle
  11. Ensemble Methods for Multi-Class Classification
  12. Predicting Movie Reviews Using NLP and Spark Streaming
  13. Word2vec for Prediction and Clustering
  14. Extracting Patterns from Clickstream Data
  15. Graph Analytics with GraphX
  16. Lending Club Loan Prediction