What are the relative merits of the American and European socioeconomic systems? Long-standing debates have heated up in recent years with the expansion of the European Union and increasingly sharp political and cultural differences between the United States and Europe. In Inequality and Prosperity, Jonas Pontusson provides a comparative overview of the two major models of labor markets and welfare systems in the advanced industrial world: the "liberal capitalist" system of the United States and Britain and the "social market" capitalism of northern Europe. These two models balance concerns of efficiency and equity in fundamentally different ways. In the 1990s the much-heralded forces of globalization (together with demographic changes and attendant political pressures) seemed to threaten the very existence of the social-market economies of Europe. Were the social compacts of Sweden and Germany outmoded? Would varieties of capitalism remain possible, or were labor-market and social-welfare arrangements converging on the U.S. norm? Pontusson opposes the notion of inevitable convergence: he believes that social-market economies can survive and indeed flourish in the contemporary world economy. He bases his argument on an enormous amount of highly specialized research on eighteen countries, using national-level data for the last thirty years. Among the areas he explores are labor-market dynamics, income distribution, employment performance, wage bargaining, firm-level performance, and the changing possibilities for the welfare state.

- 256 pages
- English
- ePUB (mobile friendly)
- Available on iOS & Android
eBook - ePub
About this book
Trusted by 375,005 students
Access to over 1.5 million titles for a fair monthly price.
Study more efficiently using our study tools.
Information
CHAPTER 1
Rethinking the Trade-off between Growth and Equality
Across the advanced capitalist countries, economic growth has been quite sluggish over the last twenty-five years, at least by the standards of the golden postwar era. At the same time, income disparities have increased. In the United States, low-income families experienced a steady decline in real income from the late 1970s through the first half of the 1990s. This decline came to an end as employment growth accelerated in the course of the 1990s, but inequality remains an enduring legacy of the last quarter century. In some European countries, labor market institutions have constrained inegalitarian market forces and welfare states have to a greater extent compensated low-income families, but these achievements seem to have been accompanied by more sluggish employment growth. Are we caught in a situation in which governments can no longer do much to improve the economic prospects of low-income workers and their families?
This book explores public policy issues related to economic growth, employment, and income distribution by means of cross-national comparison. For all the talk of globalization in recent years, it remains meaningful and quite instructive, I believe, to analyze national economies and to compare them. Such an exercise strikes me as particularly appropriate in view of the current disengagement in the “war of the models.”1 In Europe, Margaret Thatcher became the figurehead of radical pro-market forces in the 1980s, advocating an embrace of the American model. Politically, this movement ran out of steam in the early 1990s, paving the way for a more pragmatic and incremental approach to economic reform. On the other hand, foreign models seem to have disappeared almost entirely from American public debate as Germany and Japan have been overcome by economic and political difficulties. To hail either of these countries as a model for America, as many did in the 1980s, would today seem quite ridiculous. Are there no longer any alternative models to be admired and perhaps emulated? I shall try to make the case that there is still a viable European model of welfare capitalism, but this model is different from the German model of the 1980s.
The complex of issues that I explore in this book revolves around the relationship between, on the one hand, equality, redistribution, and social protection and, on the other hand, economic efficiency, growth, and employment. The theme of equality and efficiency, whether and how they might be reconciled, lies at the core of democratic politics in capitalist societies, always lurking behind the narrower issues that we contest in elections and legislative battles. While capitalism generates inequality, democracy is a source of egalitarian pressure.
The rich have many more resources to influence the political process than the poor do, but democracy still entails formal equality among citizens: each person has one vote, and elections do matter. The distribution of power in the polity is more equal than the distribution of power in the economy. And even in the most egalitarian of today’s capitalist societies, the distribution of income is skewed toward the rich in the sense that the distance between the incomes of households in the top decile of the income distribution and the median household income is invariably larger—typically much larger—than the distance between the incomes of households in the bottom decile and the median household. Put differently, the median household income is less than the mean household income. This means that a majority of households stands to gain from progressive taxation and redistributive spending.2 At the same time, however, all citizens who are motivated by material concerns, even those at the very bottom of the income distribution, must worry about the average standard of living in their society. For the majority, a more egalitarian society is preferable to a less egalitarian society, but a rich society is also preferable to a poor society. Democratic capitalist politics is about distributive conflict tempered by a common interest in economic growth.
The egalitarian logic of democracy manifests itself in the industrial sphere as well as in the political sphere. A very substantial body of research demonstrates that collective bargaining between employers and unions typically produces a more egalitarian distribution of wages than that which results when wages are set by contracting between employers and individual employees. In the United States, wages in unionized sectors of the economy tend to be more compressed than wages in non-union sectors, and a significant part of the increase in wage inequality since the 1970s can be attributed to de-unionization. On a cross-national basis, we also observe a consistent association between unionization and wage compression. Unions are not necessarily paragons of democratic virtue, but their internal decision-making usually involves voting, based on the “one person, one vote” principle and some approximation of majority rule. Whenever the mean wage exceeds the median wage, we might expect a majority of union members to favor redistributive wage demands, with some portion of wage increases perhaps being specified in dollars rather than as a percentage of current wages. Again, however, there is an important caveat for this expectation: the majority of union members can be expected to support redistributive wage demands only so long as such demands do not negatively affect their employment situation.
For a host of historical reasons, the egalitarian thrust of democratic politics has been more pronounced in Western Europe than in the United States.3 While the United States lagged behind Western Europe in the development of comprehensive social welfare provisions during the postwar era, in Western Europe the Scandinavian countries led the way. Among the large European countries, West Germany developed the most comprehensive system of social protection, coordinated wage bargaining, and industrial citizenship. Borrowing a term coined by German Christian Democrats in the 1950s, I here refer to Germany and its immediate neighbors—Austria and Switzerland to the south; Belgium and the Netherlands to the west; and Denmark, Sweden, Norway, and Finland to the north—as “social market economies” or, for short, SMEs. Throughout the book, I contrast the institutional arrangements of this set of countries to those of the United States and other “liberal market economies”—LMEs—and compare the two groups of countries in terms of various aspects of egalitarianism and economic performance.4
I stress at the outset that the “Social Europe” to which the title of this book refers is not the same thing as the European Union. Three social market economies—Germany, Belgium, and the Netherlands—were part of the original European Economic Community. Denmark joined in 1975, and Austria, Finland, and Sweden followed suit in 1995. Still, two of the social market economies, Norway and Switzerland, remain outside the EU and another two, Denmark and Sweden, have yet to join the single currency. On the other hand, the European Union encompasses two countries that fit the liberal market model quite well, Ireland and the United Kingdom, and several southern European countries that do not neatly fit either model. This said, it is impossible to discuss the experience of the social market economies over the last two decades without some discussion of the process of European economic and political integration. Decisions by the European Union influence the social market economies in powerful ways. It is also the case that the political debate surrounding the future of the social market model in Germany and elsewhere matters greatly to the evolution of the European Union.
THE “EUROPE VS. AMERICA” DEBATE REVISITED
It is commonplace for economists, not to mention business reporters, to posit a trade-off between efficiency and equality. A famous essay by Arthur Okun refers to this as “the big trade-off.” Observing that “the market creates inequality and efficiency jointly,” Okun flatly asserts that “we can’t have our cake of market efficiency and share it equally.” It is noteworthy that Okun quickly qualifies this statement by noting that “the presence of a trade-off between efficiency and equality does not mean that everything that is good for one is necessarily bad for the other . . . techniques that improve the productivity and earnings potential of unskilled workers might benefit the society with greater efficiency and greater equality.”5 For Okun, inequality of opportunity is a source of inefficiency as it implies a misallocation of natural talent, but inequality of rewards boost efficiency by providing individuals with incentives to invest, to innovate, and to work hard.
According to the economic orthodoxy of our times, which I shall refer to as the “market-liberal view,” governments may create a more equal distribution of income and consumption through taxation, transfer payments, and the provision of services, but in so doing they inevitably distort market forces and undermine efficiency, which in turn leads to slower growth, less employment, and lower average standards of living.6 In the debate about whether or not the minimum wage should be increased, we are often told that this type of government intervention in the labor market is counterproductive, creating a disincentive for employers to hire low-skilled workers. The same logic applies to union efforts to raise the relative wages of the low-paid through collective bargaining. The market-liberal view holds that redistributive policies not only have negative consequences for average incomes; worse still, they especially hurt the people they are supposed to benefit.
The implication of the market-liberal view is that countries in which wages are more equally distributed should have lower living standards and/or slower rates of economic growth than countries in which wages are less equally distributed. Similarly, redistributive taxes and social programs should be associated with worse economic performance on a cross-national basis. Is this in fact so? Table 1.1 presents some very basic economic data that bear on this question. Let me immediately make clear that the purpose of presenting these data here is not to settle the matter, but rather to frame the treatment of more specific questions and more detailed evidence in the chapters that follow.
Table 1.1 includes data for eighteen OECD countries, that is, long-time member states of the Organization for Economic Cooperation and Development (OECD).7 The first column presents the most recent observations of Gini coefficients for disposable household income available from the Luxembourg Income Study. The Gini coefficient is a commonly used measure of income inequality, the meaning of which will be discussed at some length in chapter 3. Suffice it to say for now that higher numbers signify greater inequality. Among the nine countries that I classify as “social market economies,” Switzerland stands out as the least egalitarian country by this measure, with a Gini coefficient of .307. The other eight SMEs fall in a fairly narrow range, with Gini coefficients between .236 (Denmark) and .266 (Austria). By contrast, Gini coefficients for the “liberal market economies” range between .302 (Canada) and .366 (U.S.). The distinction between SMEs and LMEs appears to correspond to a major divide among advanced capitalist countries with respect to income distribution.8 To put these figures in perspective, it might be noted that the Gini coefficient for the United States, as measured by the Luxembourg Income Study, increased from .301 in 1979 to .372 in 1997 (and then fell slightly from 1997 to 2000). Most observers would agree that inequality among American households increased dramatically over this period. In absolute terms, the difference between the average Gini coefficient of SMEs (.257) and the average Gini coefficient for LMEs (.330) in the 1990s is of just about the same magnitude as the difference between the U.S. Gini coefficients for 1979 and 1997.
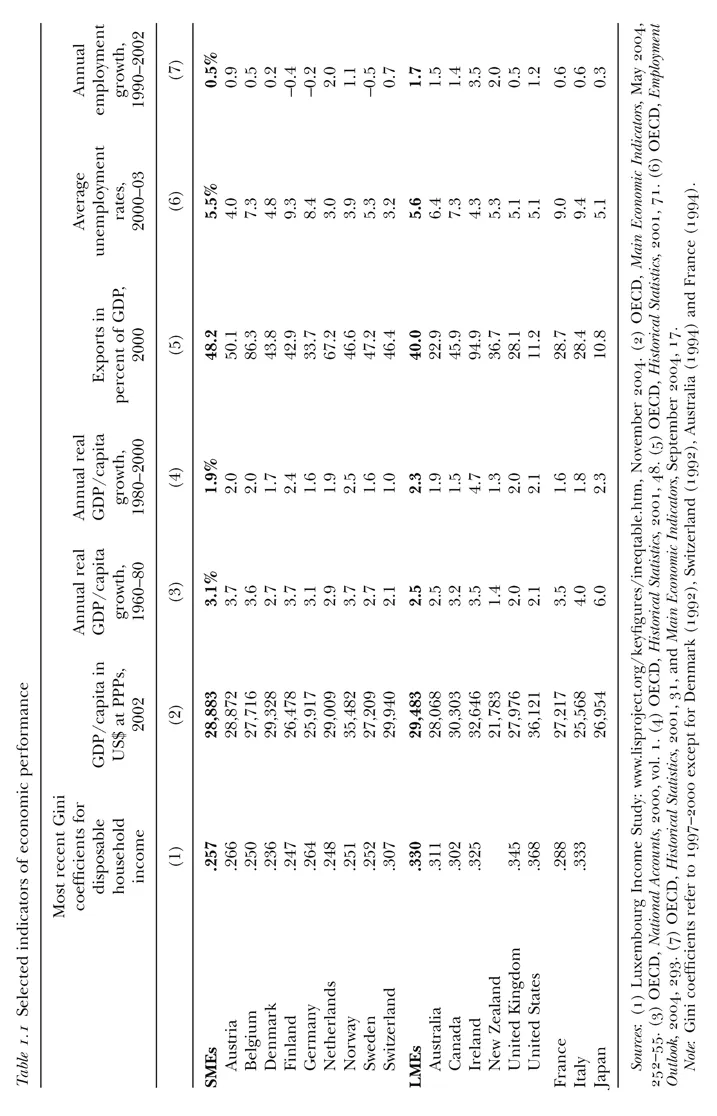
The second column of table 1.1 provides 2002 figures on GDP per capita, expressed in U.S. dollars. “GDP per capita” is the value of all goods and services produced by an economy divided by the total population. The conversion into U.S. dollars was done at “purchasing power parities,” which is to say that these figures take into account cross-national differences in the cost of living. The figures in the second column thus provide a measure of average living standards that can be compared, at least roughly, across countries. With a GDP per capita of $36,121, the United States stands out as the richest of all the rich countries. It is noteworthy, however, that the poorest of all the countries included in table 1.1, New Zealand, is also a liberal market economy, and that the second-richest country, Norway, is a social market economy. Generalizing across all LMEs and SMEs, average living standards in these two sets of countries appear to be more or less the same.
Needless to say, resource endowments and a host of other factors that have little or nothing to do with politics or political-economic institutions must be taken into account to explain why some countries are richer than others. The unique characteristics of the continental American economy hardly need to be belabored. While oil revenues are the key to Norway’s relative prosperity, New Zealand’s unique combination of small size and geographic isolation (the latter restricting its ability to reap the benefits of international trade) obviously puts it at a disadvantage.
Arguably, economic growth rates provide a better standard for assessing the relative merits of social and liberal market economies as models of economic governance than (cumulative) levels of economic development. The third and fourth columns of table 1.1 report average annual growth rates of GDP per capita from 1960 to 1980 and from 1980 to 2000, respectively. Despite higher taxes and a more egalitarian distribution of income, the social market economies of northern and central Europe generally achieved higher rates of economic growth than the liberal market economies over the 1960s and 1970s. Looking at the figures in column 4, it is immediately apparent that New Zealand’s anemic performance drags down the average growth rate for the LMEs, but even without New Zealand the LME average is considerably lower than the SME average (2.7 percent as compared to 3.1 percent). Crucially, the apparent success of social market economies in achieving more rapid growth under more egalitarian auspices in this period was not based on insulation against the competitive pressures of world markets. To the contrary, the social market economies of northern and central Europe have long been more dependent on international trade than most liberal market economies. As background information, the fifth column of table 1.1 provides figures on the value of exports relative to GDP in 2000.9
In all but three of the OECD countries, average annual growth rates from 1980 to 2000 were lower than the corresponding figures for the previous two decades. Unchanged, the comparatively low growth rates of the United States and the United Kingdom in the 1960s and 1970s became standard growth rates in the 1980s and 1990s. As indicated by the fourth column of table 1.1, the deceleration of economic growth was much more pronounced for SMEs than for LMEs. On average, LMEs performed better than SMEs over the last two decades of the twentieth century, but this difference is largely, if not entirely, attributable to Ireland’s “economic miracle.” Excluding the fastest-growing country in each group (Norway and Ireland), the average growth rates of LMEs and SMEs turn out to be exactly the same from 1980 to 2000: 1.8 percent per year. To be sure, the determinants of economic growth are complex, and we ought to control for a number of other factors in order to assess the impact of income distribution, political-economic institutions, and government policy. For now, suffice it to say that simple comparisons of growth rates over extended periods of time do not yield any unambiguous support for the proposition that liberal market economies are inherently superior to social market economies.
Many authors invoke the postwar experience of the social market economies not only to question the idea of a necessary trade-off between equality and efficiency, but also to suggest that egalitarianism and big government may be good for...
Table of contents
- Foreword
- Acknowledgments
- 1. Rethinking the Trade-off between Growth and Equality
- 2. Varieties of Capitalism
- 3. Income Distribution and Labor Markets
- 4. Employment Performance
- 5. Macro-Economic Management and Wage Bargaining
- 6. Participation, Security, Mobility, and Skills
- 7. Welfare States, Redistribution, and Economic Growth
- 8. Welfare States in Retrenchment
- 9. Directions for Progressive Reform
- Notes
Frequently asked questions
Yes, you can cancel anytime from the Subscription tab in your account settings on the Perlego website. Your subscription will stay active until the end of your current billing period. Learn how to cancel your subscription
No, books cannot be downloaded as external files, such as PDFs, for use outside of Perlego. However, you can download books within the Perlego app for offline reading on mobile or tablet. Learn how to download books offline
Perlego offers two plans: Essential and Complete
- Essential is ideal for learners and professionals who enjoy exploring a wide range of subjects. Access the Essential Library with 800,000+ trusted titles and best-sellers across business, personal growth, and the humanities. Includes unlimited reading time and Standard Read Aloud voice.
- Complete: Perfect for advanced learners and researchers needing full, unrestricted access. Unlock 1.5M+ books across hundreds of subjects, including academic and specialized titles. The Complete Plan also includes advanced features like Premium Read Aloud and Research Assistant.
We are an online textbook subscription service, where you can get access to an entire online library for less than the price of a single book per month. With over 1.5 million books across 990+ topics, we’ve got you covered! Learn about our mission
Look out for the read-aloud symbol on your next book to see if you can listen to it. The read-aloud tool reads text aloud for you, highlighting the text as it is being read. You can pause it, speed it up and slow it down. Learn more about Read Aloud
Yes! You can use the Perlego app on both iOS and Android devices to read anytime, anywhere — even offline. Perfect for commutes or when you’re on the go.
Please note we cannot support devices running on iOS 13 and Android 7 or earlier. Learn more about using the app
Please note we cannot support devices running on iOS 13 and Android 7 or earlier. Learn more about using the app
Yes, you can access Inequality and Prosperity by Jonas Pontusson in PDF and/or ePUB format, as well as other popular books in Politics & International Relations & Comparative Politics. We have over 1.5 million books available in our catalogue for you to explore.