- 122 pages
- English
- ePUB (mobile friendly)
- Available on iOS & Android
eBook - ePub
Econometrics for Daily Lives, Volume I
About this book
Econometrics for Daily Lives helps you collect data and analyze the relationship among numerous factors facing you in your everyday activities. This first volume comprises two parts. Part I reviews basic statistics and introduces the most elementary topics in econometrics, including simple regressions and multiple regressions. Part II discusses several problems arisen in data analyses, one problem at a time, so that you can learn to deal with each problem without having to master advanced topics in econometrics. The volume is full of examples and practical guidance on how to perform data analyses using Microsoft Excel.
Trusted by 375,005 students
Access to over 1.5 million titles for a fair monthly price.
Study more efficiently using our study tools.
Information
PART I
Elementary Topics
This part contains three chapters:
• Chapter 1 Introduction
• Chapter 2 Simple Linear Regressions
• Chapter 3 Multiple Linear Regressions
CHAPTER 1
Introduction
“It is a normal distribution!!” exclaims Booka, the owner of Bookwebki. Invo the investor is curious, “What is that?” Booka replies, “I tried to draw a histogram of my store’s sales on a type of book with different designs, and it came up very close to a normal distribution.” We all look at the teacher, “What is a histogram?” Professor Metric, our teacher, responds cheerfully that we will learn these basic concepts very soon and that by the time we finish this chapter, we will be able to do the following:
1. Discuss the nature of an econometric model.
2. Explain basic concepts of probability.
3. Distinguish inferential statistics from descriptive statistics.
4. Perform simple data manipulations and calculations using Excel.
He then leads us into the first section of the lecture.
What Is Econometrics?
Econometrics is a branch of economics that uses statistical methods and mathematics to estimate any relationship in everyday life, test any hypothesis and theory, evaluate business strategies, and implement public policies. There is a big difference between a theoretical model and an econometric model. A theoretical model studies hypothetical relations between variables using a general function. For example, let the variable WAGE represent the average weekly wage of a person and the variable SPEND represent his or her spending on nondurable goods and services such as food, clothes, haircuts, and so on. Then we can write a theoretical model as

where a1 is a constant representing the average nondurable spending by a person with WAGE = 0, and a2 is the change in spending due to a unit change in personal wage.
An econometric model quantifies that relationship. In order for you to estimate the value of the parameters a’s and test for their significance, the model is written in a particular way as follows:

where a1 is the intercept and a2 is the slope of the regression line. The random error, e, accounts for a set of unobserved factors that might affect SPEND other than WAGE or any random component in the model. Figure 1.1 illustrates this relationship, with a1 as the intercept, a2 as the slope of the regression line, and e as the distance from an actual data point to the regression line.
The variable on the left-hand side is called the dependent variable (SPEND in this case), and the variable on the right-hand side is called the independent variable if we have only one variable on the right-hand side (WAGE in this case) or explanatory variables if we have more than one variable on the right-hand side.
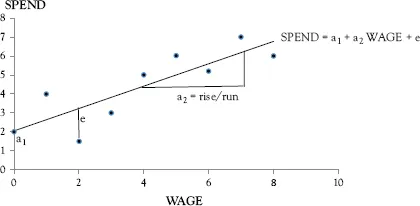
Figure 1.1 Relationship between wage and spending
Basic Steps
There are usually three basic steps in econometric research:
Step 1: | Selecting the Model Depending on the problem and the availability of the information, an appropriate model should be decided. In the preceding example, our model is specified in Equation (1.2). |
Step 2: | Collecting and Analyzing Data Data can be collected directly by the user (primary data) or by someone other than the user (secondary data). Data analyses consist of constructing data plots, obtaining descriptive statistics, and performing certain techniques to quantify the relationship between a dependent variable and one or more explanatory variables. |
Step 3: | Interpreting the Results Evaluations of the results are performed based on hypothesis testing and other measures. Based on the interpretations of the results, implications concerning economic theory and practical policies are drawn. |
Statistics Primer
Professor Metric emphasizes that statistics provides important tools for data analysis and you can spend your whole life studying it. However, some basic knowledge of statistics, discussed in the following section, is enough to understand econometric techniques in part one. More concepts will be introduced later.
Probability
Probability is the likelihood of an event occurring and is measured by the ratio...
Table of contents
- Cover
- Half-title Page
- Title Page
- Copyright
- Abstract
- Contents
- Preface
- Acknowledgments
- Part I Elementary Topics
- Part II Intermediate Topics
- Bibliography
- About the Author
- Index
- Backcover
Frequently asked questions
Yes, you can cancel anytime from the Subscription tab in your account settings on the Perlego website. Your subscription will stay active until the end of your current billing period. Learn how to cancel your subscription
No, books cannot be downloaded as external files, such as PDFs, for use outside of Perlego. However, you can download books within the Perlego app for offline reading on mobile or tablet. Learn how to download books offline
Perlego offers two plans: Essential and Complete
- Essential is ideal for learners and professionals who enjoy exploring a wide range of subjects. Access the Essential Library with 800,000+ trusted titles and best-sellers across business, personal growth, and the humanities. Includes unlimited reading time and Standard Read Aloud voice.
- Complete: Perfect for advanced learners and researchers needing full, unrestricted access. Unlock 1.5M+ books across hundreds of subjects, including academic and specialized titles. The Complete Plan also includes advanced features like Premium Read Aloud and Research Assistant.
We are an online textbook subscription service, where you can get access to an entire online library for less than the price of a single book per month. With over 1.5 million books across 990+ topics, we’ve got you covered! Learn about our mission
Look out for the read-aloud symbol on your next book to see if you can listen to it. The read-aloud tool reads text aloud for you, highlighting the text as it is being read. You can pause it, speed it up and slow it down. Learn more about Read Aloud
Yes! You can use the Perlego app on both iOS and Android devices to read anytime, anywhere — even offline. Perfect for commutes or when you’re on the go.
Please note we cannot support devices running on iOS 13 and Android 7 or earlier. Learn more about using the app
Please note we cannot support devices running on iOS 13 and Android 7 or earlier. Learn more about using the app
Yes, you can access Econometrics for Daily Lives, Volume I by Tam Bang Vu in PDF and/or ePUB format, as well as other popular books in Economics & Econometrics. We have over 1.5 million books available in our catalogue for you to explore.