![]()
Chapter 1
Automobile Sales
Leading into Recessions, Coincident with Lagging Recoveries
(See also ISM Manufacturing Survey)
BACK IN 1953 THE head of GM, Charles Wilson, said that “what was good for the country was good for General Motors and vice versa.” It’s still true that cars (GM’s or otherwise) count when it comes to the economy, especially for the manufacturing sector.
Just think about all the things that are needed to make a car or truck: steel sheet for body panels, paint, glass for wind-shields and lights, copper for electrical wiring, rubber for tires, plastic, fabric, and possibly leather for interiors. What it all means is that when the big car companies like Ford Motor, Toyota, General Motors, Chrysler, Honda, and Hyundai are making and selling cars, then businesses in a lot of ancillary industries are working hard too.
“This is not a niche indicator,” says Campbell Harvey, professor of finance at Duke University’s Fuqua School of Business. “The auto industry is interconnected with so much else that by watching its movements you get some view of the overall health of the economy.”
For most people, the cost of a car or truck is large—a major purchase second only to the cost of buying a house or apartment. A new car that costs thirty thousand dollars (not an unreasonable price at the time of writing in 2010) would be a large chunk of many folks’ pretax annual income, and greater than a year’s pay for some. As a result, many people borrow money to buy cars and trucks. When they do, it tells us something about how confident they feel about their economic and financial future. “They are not going to go out and buy a car if they think there is reasonable chance they’ll get laid off,” explains Harvey.
Investment Strategy
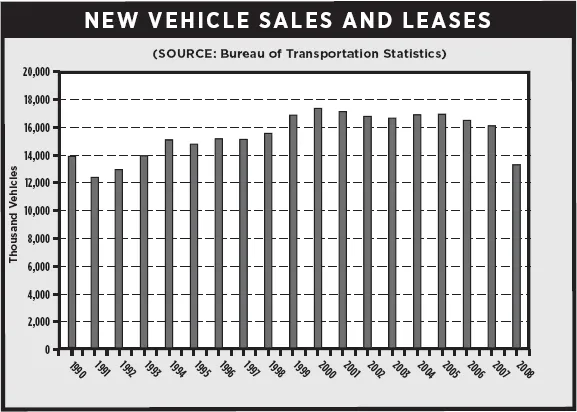
Car sales are a decent leading indicator of impending recessions as people tend to back off buying cars when they don’t feel confident about their jobs. Coming out of a recession, car sales tend to lag because most people wait until the economy has clearly turned upward before making such a major purchase.
As shown in the accompanying chart, sales of new autos slowed before the 2000–1 downturn. They picked up a little during the mid-decade boom before dropping dramatically in 2007 as the economy began to show signs of weakness.
One of the keys with automobile sales is to focus on sales and leases of new cars because, in the end, they drive the other parts of the economy. The sale of a used car doesn’t actually mean any new materials were used, although it’s still a good sign that people want to buy another vehicle.
That said, when parsing the automobile sales data you need to look for trends.
“Try to detect a clear momentum, a positive or negative trend,” says Harvey. “Take a look at where we are relative to recent history and see if there is any consistency.”
If there is a consistent decrease in sales, then we are likely seeing the economy head into a period of weakness, he says. Likewise, if the trend is higher, then the economy may be improving. Harvey also notes that the fact that so many people borrow to buy cars can actually disturb the sales trends a bit. During economic slowdowns interest rates tend to fall, thus making borrowers’ car payments much lower, sometimes dramatically so. That added affordability can sometimes drive sales up a tad better than expected when the economy is weak.
When automobile sales look like they are signaling a slowdown or recession, it makes sense to avoid investing in assets usually sensitive to the economic cycle. In other words, shun stocks in favor of government securities and high-quality corporate bonds.
EXEC SUMMARY: AUTOMOBILE SALES
When to look: Auto sales figures are released on the first business day of each month. The data covers the previous month’s sales.
Where to look: Reporters working for The Wall Street Journal file breaking news stories on WSJ.com as the various auto companies release their data. When all the data is released, an overall story is published that explains all the figures and interprets the state of the industry.
Go to The Wall Street Journal online’s, “Market Data Center” for a quick read of the data and how it compares to what investors were expecting. You’ll find the data center at www.WSJMarkets.com. When you are there, you’ll need to go to the “Calendars & Economy” section and find the “Auto Sales” link.
Other sources include the website of the Bureau for Transportation Statistics: www.bts.gov/publications/national_transportation_ statistics/. The car-making companies, such as General Motors, Ford Motor, Chrysler, Hyundai, Honda, and Toyota, also provide detailed disclosures of their sales figures.
What to watch for: Decreases in new automobile sales and leases.
What it means: People are pulling back due to fears about their future employment status.
What to do: Avoid investing in assets usually sensitive to the economic cycle. In other words, shun stocks in favor of government securities and high-quality corporate bonds.
Risk level: Medium.
Profit possibility: $$
![]()
Chapter 2
Chain Store Sales
Coincident
AMERICANS LOVE TO CONSUME stuff, and consumption is a vital part of our overall economic well-being. Because most of us go to retailers in order to buy goods and ser vices, we can gain insights into the health of consumption by looking at retail sales.
Although much of the data on the retail sector is available only long after the fact, some of it is very timely, and it comes from some of the most sophisticated retailers in the world, including chain stores like Saks (SKS) and The Gap (GPS) and membership warehouse retail stores such as BJ’s (BJ) and Costco (COST). Together, the chain stores represent only 10% of overall retail sales, but the data about these companies’ sales is available every Tuesday for the week through the prior Saturday.
This data is important for more than just its timeliness. Chain stores tend to operate across the entire United States and not just regionally. So we can get a national read on the state of consumption.
In addition, chain stores are master sellers. They use the latest selling techniques and hire the savviest marketers. They also have the financial weight and the robust distribution systems to get first dibs on the latest new gadgets. Why does this matter? Because if the big guys aren’t selling, then the rest of the retail world stands little chance.
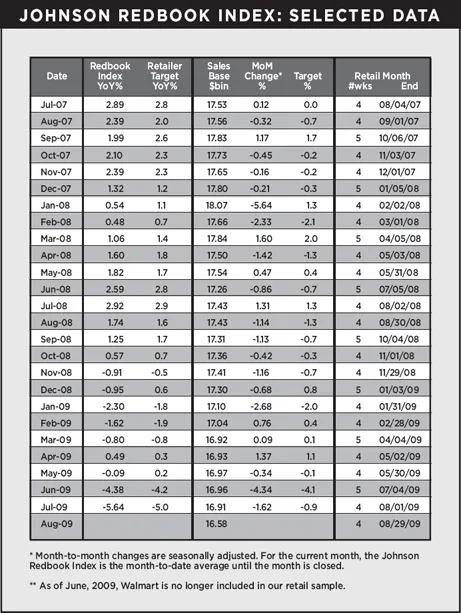
There are two sources of basic data: the Johnson Redbook Index and the ICSC-Goldman Sachs Weekly U.S. Retail Chain Store Sales Index. Both entities also put out monthly figures. (For a broader view that includes smaller retailers as well, see the Census Bureau’s monthly retail sales report.)
Investment Strategy
Economic forecasters should watch this data closely because of the giant portion of overall GDP that consumption represents. When the data shows that chain store sales have increased, then the consumption component of the overall economy is probably doing quite well. When chain store sales are weak or falling, then the opposite is likely true.
Data on chain store sales can also be used when deciding whether to invest in retail stocks like Saks (SKS), Target (TGT), and J.Crew (JCG).
But you need to be careful. “You have to be really good and nimble to buy a stock based on this data,” says Kristin Bentz, a veteran retail industry analyst at the Conshohocken, Pennsylvania– based investment bank PMG Capital.
Still, she has some useful tips for the would-be investor. In the first place, not all of the chain store sales data is that useful to investors. Sales of big retailers go up and down for many reasons including the opening and closing of different stores. To get useful information, new stores (those open less than twelve months) need to be excluded.
Instead, investors in retail companies look at the sales of stores open for a year or more. The data is known as the same-store sales in the United States and (like-for-like sales in Britain). It’s a measure of the efficiency of retailing operations. This data is available the first Thursday every month, so it’s not as timely as the raw data but it’s far more useful for investors.
“When picking a stock to buy you want sequential and year-over-year same-store-sales growth,” Bentz says. More simply: The data should show increased sales when compared to the same period a year ago and when compared to the prior month.
“That tells you the product is right, the trend is right, and the customers are coming back month after month,” she explains.
On top of that it’s important to look at what expectations of same-store sales were for that period. A company can have the right year-on-year and sequential results but still fall short of what analysts were expecting, and in that case the stock would likely suffer.
“When you get sequential and period growth, and the company is beating forecasts, then that’s a buy,” notes Bentz.
She adds that during the boom years it made some sense to look at exchange-traded funds that tracked the value of a basket of retail stocks, like the SPDR S&P Retail (XRT) ETF. But during the Great Recession things changed. Now, she says, not all retailers are created equal and it therefore makes sense to pick and choose which stocks to buy.
EXEC SUMMARY: CHAIN STORE SALES
When to look: For monthly same-store-sales data, be on watch the first Thursday of the month; weekly data from ICSC and Red-book data are available early Tuesday mornings.
Where to look: The Wall Street Journal closely follows retail sales figures. Journal reporters file breaking news reports on retail sales figures as the numbers are released. Check for articles covering the entire industry, as well as those with company-by-company detail.
Go to The Wall Street Journal online’s “Market Data Center” for a quick read of the data and how it compares to what investors were expecting. You’ll find the data center at www.WSJMarkets.com. When you are there, you’ll need to go to the “Calendars & Economy” section, look for “U.S. Economic Events,” and find the links to ICSC and Redbook on Tuesdays. Monthly same-store-sales data is available directly on many publicly traded retailers’ websites.
The Johnson Redbook Index is available to clients of Redbook Research, although there are some samples available at no charge on its website: www.redbookresearch.com.
For those willing to pay, Bentz recommends going to Retail Metrics, where proprietor Ken Perkins provides an “enormous” spreadsheet of all the data.
What to watch for: Increases (declines) in year-over-year same-store-sales growth, as well as month-to-month increases.
What it means: Stores are doing well (struggling).
What steps to take: Buy (sell) as expectations of year-over-year same-store sales improve (degrade).
Risk level: Medium.
Profit possibility: $$
![]()
Chapter 3
Consumer Sentiment
Leading
THE UNITED STATES MAY be many things, but if nothing else it is a nation of spenders. As a result, investors and economists devote a massive amount of time worrying what “the consumer” thinks, or how he is feeling. Simply speaking, when consumers feel better they spend more.
Despite all that angst, very few economic indicators just plain ask the proverbial man on the street, “How are you feeling?” Most other indicators measure what people have done or are doing.
The simple idea of asking what you and I are thinking or feeling has been taken up by two institutions: The Conference Board and...