The Great Global Warming Blunder unveils new evidence from major scientific findings that explode the conventional wisdom on climate change and reshape the global warming debate as we know it. Roy W. Spencer, a former senior NASA climatologist, reveals how climate researchers have mistaken cause and effect when analyzing cloud behavior and have been duped by Mother Nature into believing the Earth’s climate system is far more sensitive to human activities and carbon dioxide than it really is.In fact, Spencer presents astonishing new evidence that recent warming is not the fault of humans, but the result of chaotic, internal natural cycles that have been causing periods of warming and cooling for millennia. More carbon dioxide in the atmosphere is not necessarily to be feared; The Great Global Warming Blunder explains that burning of fossil fuels may actually be beneficial for life on Earth.As group-think behavior and misguided global warming policy proposals threaten the lives of millions of the world’s poorest, most vulnerable citizens, The Great Global Warming Blunder is a scintillating exposé and much-needed call for debate.
eBook - ePub
The Great Global Warming Blunder
How Mother Nature Fooled the World's Top Climate Scientists
- 216 pages
- English
- ePUB (mobile friendly)
- Available on iOS & Android
eBook - ePub
The Great Global Warming Blunder
How Mother Nature Fooled the World's Top Climate Scientists
About this book
Trusted by 375,005 students
Access to over 1.5 million titles for a fair monthly price.
Study more efficiently using our study tools.
Information
Chapter 1 · Climate Change Happens
Despite what the United Nations’ IPCC would like you to believe, natural climate variability occurs on every time scale of any practical interest to humans: years, decades, centuries, millennia, and everything in between. Some of this variability is due to known cycles such as El Niño, La Niña, and the Pacific Decadal Oscillation. What the “scientific consensus” has failed to account for is that global warming (or cooling) can happen through natural cloud changes altering the amount of sunlight being absorbed by the Earth.
YOU WOULDN’T THINK that a book on climate change would need to prove that natural climate variability exists. But one of the fundamental tenets of the current “scientific consensus” on global warming is that humans now control the future course of the global climate system.
The United Nations’ Intergovernmental Panel on Climate Change does acknowledge that there is natural climate variability on a year-to-year basis, and maybe even decade-to-decade. After all, we have clear evidence that events like El Niño and La Niña cause some years to be warmer than others. Yet the IPCC refuses to accept that global warming (or cooling) on time scales of thirty years or more can also be caused by Mother Nature. That, apparently, is humanity’s job.
But, contrary to the claims of the IPCC, there is no basis for assuming that natural climate change can’t occur on just about any time scale. For instance, let’s examine the last 2,000 years of global average temperature variations.
dp n="31" folio="2" ?GLOBAL TEMPERATURE VARIATIONS: 0 A.D. TO 2009
The top panel of Fig. 1 shows an average of eighteen non-tree-ring temperature “proxies” from fifteen locations around the world.1 Proxies are indirect methods used to estimate temperatures in the distant past, before there were thermometers. Tree-ring proxies were specifically excluded by the researcher who published these data since they are not very good indicators of temperature change–an issue I will return to later.
The plotted values in the first panel are thirty-year averages. The two most prominent features are the Medieval Warm Period, centered around 1000 A.D., and the Little Ice Age, which occurred several hundred years later. During the Medieval Warm Period, the Vikings arrived in Greenland and started farming. Wine grapes were being grown in England. Then, as the Little Ice Age was advancing centuries later, the Viking colonization of Greenland ended when crops failed from the long, slow slide into a colder climate.2 In the depths of the Little Ice Age, winter carnivals (“frost fairs”) were held on the frozen River Thames in London. 3 The Thames no longer freezes in winter, and the last frost fair was held during the winter of 1814.
Superimposed on these two major features are shorter periods, about 50 to 100 years in duration, when rapid temperature changes occurred, both cooling and warming. Note that the twentieth century was one of these periods of relatively rapid temperature change. This suggests that the warming in the twentieth century, while noteworthy, was not unprecedented. In fact, it appears that periods of 50 to 100 year of rapid warming or cooling have been the rule, rather than the exception, over the last two millennia.
In the second panel of Fig. 1 we zoom in on the most recent 100 years, the period during which humans are allegedly responsible for global warming. The temperature curve is now made up of five-year averages, rather than thirty-year averages, and is based on real thermometer measurements.4 While the thermometers are sparsely distributed around the world, this at least puts us a step closer to being able to monitor variations in global average temperature accurately.
dp n="32" folio="3" ? Fig. 1. Global average temperature variations over the last 2,000 years.
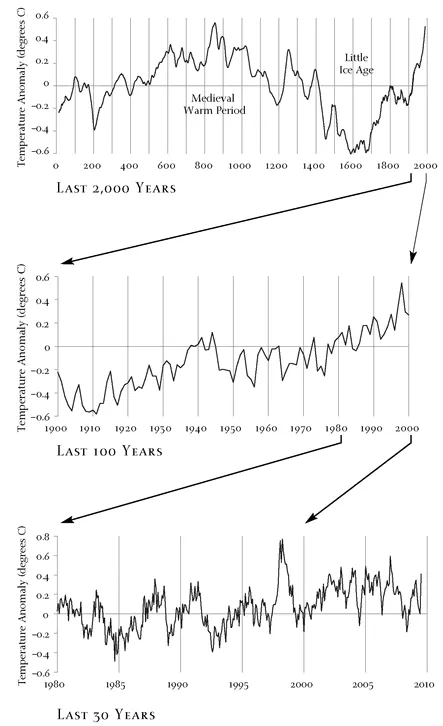
The main feature we see over the twentieth century is an overall warming trend of about 0.7 deg. C (1 .3 deg. F) per century. If we look more closely, this 100-year period appears to be split into three roughly equal segments: warming from 1900 to 1940, then slight cooling until the late 1970s, and finally resumed warming since then. Climate modelers have spent hundreds of millions of dollars over the last twenty years trying to explain this temperature behavior through human causes, mainly greenhouse gases and aerosol (particulate) pollution. In Chapter 6 we will examine the natural mechanism that I now believe is responsible for most of these temperature changes.
If we focus on the last third of the twentieth century, shown in the bottom panel of Fig. 1, we enter the satellite period of record, which allows us to make truly global measurements.5 Instead of near-surface air temperatures, which the thermometers monitor, the satellites measure the average temperature of deep atmospheric layers. While there can be some significant differences between surface and deep-layer temperature variations over the course of several weeks, on time scales of several months or more they are tightly coupled by atmospheric convection mixing the solar heating of the Earth’s surface throughout the lower atmosphere. In other words, deep-layer lower atmospheric temperature changes closely follow surface temperature changes on time scales of a few months or longer.
The geographic coverage of the Earth by the satellites is so complete that we can now calculate global average temperature variations with high precision–to about one or two hundredths of a degree C per month. We know that the large month-to-month temperature variability seen by the satellites since 1979 is real because different satellites in different Earth orbits show the same features.
All this temperature variability on a wide range of time scales reveals that just about the only thing constant in climate is change. This makes the identification of an “average” climate state very difficult, and “normal” climate nearly an oxymoron. As a result, the zero lines in the three panels of Fig. 1 are all different and somewhat arbitrary. They are based on different base periods of time chosen to reference the temperature “anomalies,” or departures from average. Note that in climate monitoring we are mainly interested in changes of temperature with time, so we seldom mention the absolute temperature values. We probably do not know the average surface temperature of the Earth to better than one degree, but with satellites we can monitor temperature changes to about a hundredth of a degree. I am often asked what those averages have been in our most recent period of record. The global average near-surface air temperature has been estimated to be around 14 deg. C (57 deg. F), while the satellite-measured lower atmospheric layer averages about–4 deg. C (24 deg. F).
Most of the temperature fluctuations seen since 1979 are due to El Niño, La Niña, and two major volcanic eruptions: El Chichón in Mexico in 1982, and Mt. Pinatubo in the Philippines in 1991. During an El Niño event, the tropical Pacific Ocean becomes warmer than normal, with less upwelling of cold water off the western coasts of North and South America.6 Normal atmospheric flows spread that unusual warmth throughout the tropical atmosphere, and then to most regions outside the tropics. The opposite happens during La Niña, with increased upwelling of cold water from the deep ocean eventually causing unusually cool global average temperatures.
On occasion, a major volcanic eruption, like Mt. Pinatubo in 1991, can eject millions of tons of sulfur into the stratosphere.7 This sulfur is converted into sulfuric acid aerosols, which then reflect back to outer space a few percent of the sunlight that would normally have warmed the surface. One or two unusually cool summers can ensue before those volcanic aerosols gradually dissipate. It is believed that the eruption of Mt. Pinatubo caused the cool conditions of 1992–1993, as seen in the bottom panel of Fig. 1.
This volcanic cooling effect is the basis for a proposed geo-engineering solution to global warming. It involves transporting massive amounts of sulfur up to the stratosphere, where it would be dumped to mimic the cooling effects of a major volcanic eruption. This “solution,” of course, assumes that there is an anthropogenic global warming problem to begin with.
THE ELUSIVE “TEMPERATURE TREND”
I frequently hear the question, “Is global warming happening now?” Unfortunately, the large amount of temperature variability seen in Fig. 1 makes that question surprisingly difficult to answer. If globally averaged temperatures were steadily increasing year after year, we would be able to answer, “yes.” Or, if temperatures were the same, year after year, we would be able to answer, “no.”
But the huge amount of variability seen in Fig. 1, on all time scales, means that “warming” is in the eye of the beholder. One commonly heard statistic is that global cooling has been in progress since 1998. But 1998 was a particularly warm El Niño year, so that statement is quite misleading. You could also say that considerable global warming has occurred since 1999, which was a cool year. But that statement would be equally misleading.
I think the best answer is that, as of this writing in late 2009, it has not warmed since about 2001. So one might legitimately claim that “global warming stopped” in 2001. But this statement has no predictive value whatsoever, since warming could resume at any time. And because there is so much year-to-year variability, we will probably have to wait several more years before we know whether warming is “happening now.” In effect, we will be able to identify warming only when we see it appear in the rearview mirror. So, there is no way to know whether global warming is happening now or not.
The warming that the IPCC considers manmade is that which occurred in the latter half of the twentieth century. In the case of the thirty-year period since 1979, for which we have satellite measurements, an underlying warming trend of about +0.13 deg. C per decade (+0.23 deg. F per decade) can be computed. Thermometer measurements from this period indicate a somewhat larger rate of warming. While this doesn’t seem like a very big number, in climate terms it is regarded as fairly rapid warming. This most recent period of warming is shown as the very last up-tick in temperature plotted as a dotted line in the top panel of Fig. 1, which indicates that it rivals the strongest warming events of the last 2,000 years.
As strong as this recent spurt of warming is, it still amounts to only about one-half the IPCC’s predicted rate of future warming in the twenty-first century: +0.3 deg. C per decade (0.5 deg. F per decade). This means that the IPCC expects warming to accelerate during this century, a rather bold prediction to say the least.
I hope that you now have a better understanding of why there are so many seemingly conflicting news reports, like “global warming is accelerating” or “global warming has stopped.” Chances are that most of these statements contain an element of truth; they just refer to different periods of time. The confusion arises because there is so much natural variability in the climate system, on all time scales. Given all this natural variability, are we to believe that humanity is now in control of climate, as the IPCC claims?
APPLES, ORANGES, AND ERRORS
Up to this point I have assumed that the global temperature estimates in Fig. 1 are free from errors. But there has been considerable debate over the accuracy of all methods of monitoring temperatures: proxies, thermometers, and satellites. No physical measurement is free of errors, and estimates of global average temperatures are no different. Some scientists have even claimed that there is no such thing as a global average temperature, and that even if there were it would be irrelevant for climate anyway. I disagree. While scientists might never agree on exactly what temperatures would go into such an average, the fact remains that the global distribution of atmospheric and surface temperatures is the largest single influence on how fast the Earth continuously loses radiant energy to outer space in the face of its continuous absorption of energy from the sun.
dp n="37" folio="8" ?The temperature proxy data have been the most controversial because they are indirect, based on such things as sea sediments and stalagmites in caves, mostly in the Northern Hemisphere. There is simply no way to determine how accurate past temperature reconstructions based on proxies are. That would require many centuries of accurate thermometer measurements, and those do not exist.
Even if the proxies provided totally accurate temperature estimates, the low time resolution of the proxy estimates in Fig. 1 (thirty-year averages) must be considered before jumping to conclusions about record warm years. For instance, 1998 is generally regarded as the warmest year for global average temperatures in at least the last 150 years. A few scientists have even proclaimed 1998 to be the warmest in the last 2,000 years, if not longer.
But I consider any such statements to be meaningless, like comparing apples to oranges. The proxy data are not good enough to tell us just how warm individual years were, say, during the Medieval Warm Period. So, for example, there is no way to know how much warmer or cooler the year 855 A.D. was compared with the year 854 A. D.
If those individual years are embedded in a very warm thirty-year period, it is entirely possible that one or more of them was considerably warmer than the “record” year of 1998. We had daily global measurements from multiple Earth-orbiting satellites in that year, and therefore we have a very good estimate of how much warmer 1998 was than 1997, probably to a precision approaching 0.01 deg. C. But there is no way to know with confidence whether 855 A.D. was warmer than 854 A.D. It is entirely reasonable to suppose–but impossible to prove–that one or more years in the Medieval Warm Period were warmer than 1998. It is easy for scientists to make grand claims when there is no way to prove them wrong.
In fact, the time scale of the temperature proxies in Fig. 1, thirty years, is exactly the same as that used by the National Weather Service to determine climatological averages, or “normals.” So, what is regarded as the highest time resolution in the proxy data is the same as the time resolution used to define climatological normal temperatures in the modern instrumental period of record. This further illustrates the absurdity of comparing the warmth of recent years with past centuries when we did not have sufficient measurements to compute accurate global averages on a yearly basis.
THE HOCKEY STICK
As mentioned earlier, the temperature proxies in the top panel of Fig. 1 ...
Table of contents
- Praise
- Title Page
- Preface
- Introduction
- Chapter 1 · Climate Change Happens
- Chapter 2 · “We Are Going to Destroy the Creation”
- Chapter 3 · Forcing: How Warming Gets Started
- Chapter 4 · Feedback: How Much Warming Results from the Forcing
- Chapter 5 · How Mother Nature Fooled the World’s Top Climate Scientists
- Chapter 6 · Global Warming: Satellite Evidence for an Alternative Explanation
- Chapter 7 · CO: Dangerous Pollutant or Elixir of Life?
- Chapter 8 · Out on a Limb: Predictions for the Future
- Summary & Conclusions
- NOTES
- Index
- Copyright Page
Frequently asked questions
Yes, you can cancel anytime from the Subscription tab in your account settings on the Perlego website. Your subscription will stay active until the end of your current billing period. Learn how to cancel your subscription
No, books cannot be downloaded as external files, such as PDFs, for use outside of Perlego. However, you can download books within the Perlego app for offline reading on mobile or tablet. Learn how to download books offline
Perlego offers two plans: Essential and Complete
- Essential is ideal for learners and professionals who enjoy exploring a wide range of subjects. Access the Essential Library with 800,000+ trusted titles and best-sellers across business, personal growth, and the humanities. Includes unlimited reading time and Standard Read Aloud voice.
- Complete: Perfect for advanced learners and researchers needing full, unrestricted access. Unlock 1.5M+ books across hundreds of subjects, including academic and specialized titles. The Complete Plan also includes advanced features like Premium Read Aloud and Research Assistant.
We are an online textbook subscription service, where you can get access to an entire online library for less than the price of a single book per month. With over 1.5 million books across 990+ topics, we’ve got you covered! Learn about our mission
Look out for the read-aloud symbol on your next book to see if you can listen to it. The read-aloud tool reads text aloud for you, highlighting the text as it is being read. You can pause it, speed it up and slow it down. Learn more about Read Aloud
Yes! You can use the Perlego app on both iOS and Android devices to read anytime, anywhere — even offline. Perfect for commutes or when you’re on the go.
Please note we cannot support devices running on iOS 13 and Android 7 or earlier. Learn more about using the app
Please note we cannot support devices running on iOS 13 and Android 7 or earlier. Learn more about using the app
Yes, you can access The Great Global Warming Blunder by Roy W Spencer in PDF and/or ePUB format, as well as other popular books in Politics & International Relations & Environment & Energy Policy. We have over 1.5 million books available in our catalogue for you to explore.