- 126 pages
- English
- ePUB (mobile friendly)
- Available on iOS & Android
eBook - ePub
Russia Moves into the Global Economy
About this book
John M. Letiche is Professor Emeritus of Economics at the University of California, Berkeley
Trusted by 375,005 students
Access to over 1.5 million titles for a fair monthly price.
Study more efficiently using our study tools.
Information
1 Russia’s economic restructuring since the 1998 crisis
Introduction
A primary objective of this study is to analyze the key factors responsible for Russia’s successful economic transition since the crisis of August 1998, factors that have frequently been misinterpreted. The study is in two parts. Part one examines Russia’s restructuring in the period from late 1998 to 2005, discusses the continuing effects of the economic legacies of the 1990s, and records the influence of President Vladimir V. Putin on the transition.1 Part two presents the basic principles applicable to the creation of a successful Russian market economy for the long term and recommends policies for integrating the Russian economy with the European- Atlantic community. The main economic indicators and the new statistical data relevant to Russia’s economic condition have been placed in an appendix.
Three sets of forces have marked the process of Russia’s economic transition since the crisis of August 1998. First, from about the third quarter of 1998 until the third quarter of 1999, the economic restructuring was primarily associated with a sharp real depreciation of the ruble. Second, thereafter, and especially until the third quarter of 2000, it was principally related to the rise in world energy prices. Third, the joint operation of these two forces in an enabling environment – though with some recent setbacks – has generated cumulative effects conducive to Russia’s long-term economic growth.
As can be seen in Figure 1.1, which indicates the real GDP growth rate of the world, United States, China, Poland and Russia from 1991 to 2005, Russia’s economic performance from the end of 1998 to 2000 was truly outstanding. Its real GDP growth rate rose from –5.3 percent in 1998 to 6.3 percent in 1999 and 10.0 percent in 2000 – stabilizing at an average rate of about 6.1 percent in 2001 through 2005.
Russia’s economic performance during most of the 1990s was catastrophic: as seen in Table 1.1, the level of its real GDP in 1998 was 40.3 percent below that of 1991. During the period 1990–1999, Russia’s real GDP growth rate was negative in every year but one – 1997 – when it grew at a lackluster rate of 1.4 percent. The percent of total population in poverty rose from a Soviet recorded 2.0 percent in 1987–1988 to 50 percent in 1993–1995.2
In the period 1991–1997, there was no correlation between Russia’s real GDP growth rate and that of the world. But from 1997 to 2000 such correlation began to occur (Figure 1.1). The causes and consequences of Russia’s dismal economic performance during most of the 1990s have been extensively discussed in the literature.3 The purpose of this analysis is to examine the main reasons for the change from economic depression to economic advance.
Overvalued currencies have been a recurring curse in economic history. In late 1991, at the time of dissolution of the Soviet Union, the ruble was an immensely overvalued, pegged exchange rate. As is shown in Appendix III, Table III.3, it was then pegged at one ruble= $5.19. Although the ruble was periodically devalued during the period 1991–1995, Russia’s rate of inflation greatly exceeded the rate of devaluation.4 Further, on a base of 1995–1997= 100, the real effective exchange rate rose from an index of 84.9 in 1995 to an index of 106.7 in 1997.5
Despite the overvalued ruble, Russia’s merchandise trade balance was positive throughout this period. The nation enjoyed huge comparative advantages in fuel, metals and wood/paper products; exports of these and other natural-resource products rose from 65 percent of total exports in 1994 to 73.3 percent in 1997.6 However, exports of most non-naturalresource products – machinery, equipment, (including cars) and instruments – remained relatively stagnant at 9.8 percent of total exports in 1994 and 10.2 percent in 1998.7 Moreover, an analysis by Russian economists on “Export Windfall Calculations” concluded that while the windfall from total exports in percent of GDP was positive in 1995, amounting to 3.2 percent of GDP, it had turned negative in 1996, 1997 and 1998, amounting to –1.1, –1.6 and –43.3 percent, respectively, of GDP.8 Clearly, the real effective overvaluation of the ruble was generated jointly by the pegged exchange rate regime in an environment of relative inflation and by a natural-resource export structure in a form traditionally known as the “Dutch disease” or the “oil curse.”
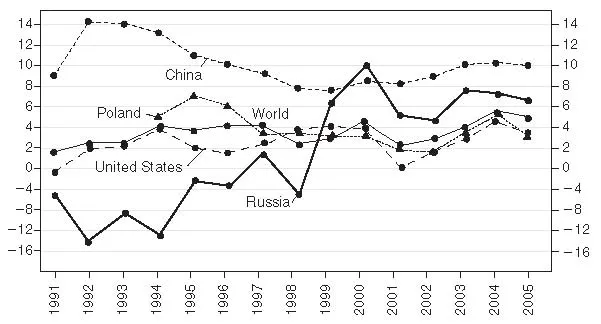
Figure 1.1 Real GDP growth rate: World, United States, China, Poland and Russia, 1991–2005.
Table 1.1a Russian federation: real GDP in United States (1990) – international dollars and real GDP growth rate 1989–2005
Table 1.1b Russian federation: GDP in terms of PPP – current international dollars (billion)
The overvalued ruble had, inter alia, a devastating effect on Russia’s agricultural production and composition of imports. As is shown in Appendix III and Appendix IV, on a base of 1990= 100, at the time of the 1998 crisis agricultural production had declined by more than 50 percent. Considering Russia’s potentially rich agricultural resources, the urgent need to modernize its agriculture is reflected in the high proportion of its food and agricultural imports: they constituted 22.2 percent of total imports in 1993 and rose to 28.3 percent by 1995.9 As another sign of Russia’s depression in the 1990s, imports of machinery and equipment as a percentage of total imports had declined from 37.7 percent in 1992 to 31.7 percent in 1996.10
From the time of the crisis until the end of 1999, on the basis of unit labor costs, the ruble had depreciated in terms of the dollar by about 70 percent, and on the basis of the consumer price index by 45 percent (Figure 1.2).11 The rise in domestic prices relative to money wages, combined with the increase in productivity and the substantial excess capacity in manufacturing, raised profits in practically all industries. Average profits in industry increased by over 15 percent in 1999. Industrial output rose in 84 out of 89 regions and included most sectors.12
As can be seen in Figure 1.3, Russia’s post-crisis economic transition has occurred in three phases. In phase one, which began in late 1998 and lasted until mid-1999, the recovery in output was driven by import substitution, not by the energy sector. In the second half of 1998, total merchandise imports (in billion U.S. dollars) fell by at least 50 percent. The volume of non-energy exports also gradually increased; though with the depreciated ruble, the dollar value of total exports in 1999 was about the same as in 1998. It was primarily the real depreciation of the ruble that brought Russia’s cost-price structure – in the non-energy fields – into line with international competitive conditions. As a result, in 1999 the foreign trade balance surged.
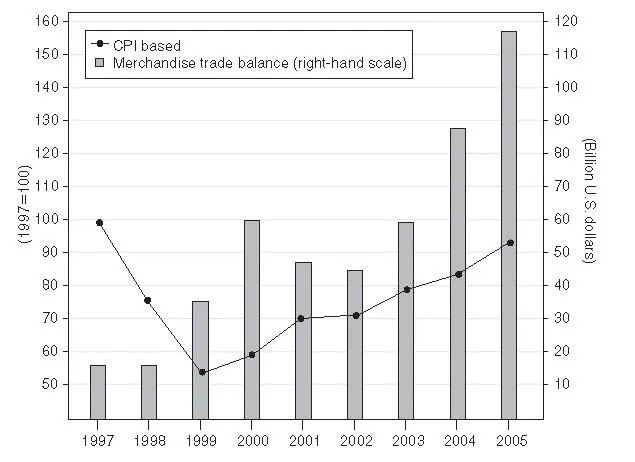
Figure 1.2 Russian federation: real exchange rate index, ruble/dollar and merchandise trade balance, 1997–2005.
The rise in profits and in retained earnings generated an expansion of investment in both industry and agriculture. Whereas gross investment had declined by 28.7 percent in 1998, it increased by 8.5 percent in 1999.13 Moreover, some of the improvement in net profits was accounted for by a reduction in gross losses that had occurred primarily in the non-energy sectors.14
On a year-on-year basis, Russia’s real GDP grew by $41.9 billion in 1999, while its energy exports increased only by $3.1 billion. Manifestly, energy exports had contributed much less to the first phase of Russia’s post-crisis economic transition than did the improvement in the external balance and the related increase in domestic investment and output that were principally associated with the real effective depreciation of the ruble.
The second phase of the economic transition, which began after the middle of 1999 and lasted until the third quarter of 2000, was driven primarily by the sharp rise in world energy prices. The average dollar price of Russia’s energy exports had declined by 37 percent from January 1997 to February 1999, but by September 2000 it had risen to 10 percent above the January 1997 level.15 The price of Russia’s crude oil was $15.79 a barrel in 1998; the price in 1999 averaged $10.09 a barrel, but it rose to $24.70 a barrel in 2000 (Figure 1.4). The value of Russia’s energy exports (oil, oil products and gas) rose rapidly thereafter, accounting in 2005 for about 63 percent of the value of Russia’s total merchandise exports.16 Gradually, more diversified channels of production have been developing, linking fluctuations in world energy prices to fluctuations in Russia’s economic activity. In the very short term, however, the rise in world energy prices after mid-1999 had little effect on Russia’s energy production: Output was constrained by bottlenecks in extraction and transportation, as well as by government policy that regulated the volume of sales at below world prices in the domestic markets.17 Consequently, in 1999, on a year-on-year basis, Russia’s oil production rose only 0.3 percent.18 But the continued rise in world oil and gas prices from about the second half of 1999 to most of 2000 had a direct effect on increasing Russia’s energy production, especially in 2001. Rising profits and retained earnings generated an expansion of domestic and foreign investment in exploration for, and output of, both oil and gas.
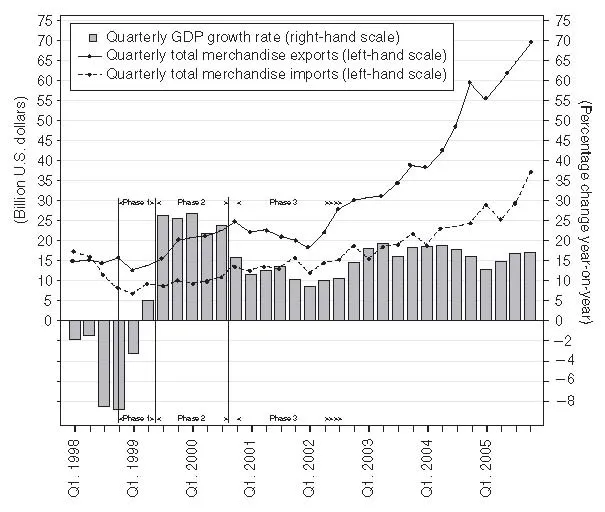
Figure 1.3 Russian federation: real quarterly GDP growth rate and quarterly change in total merchandise exports and imports, 1998–2005.
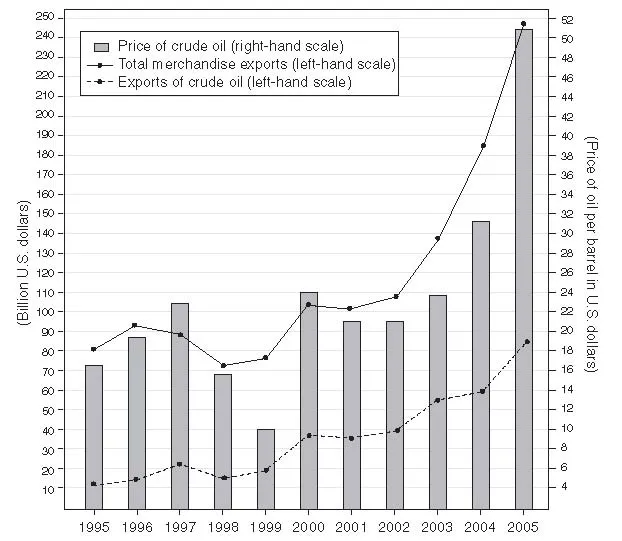
Figure 1.4 Russian federation: price of oil, exports of crude oil and total merchandise exports, 1995–2005.
Furthermore, most energy companies set about improving their infrastructure, thereby stimulating demand for domestically produced oil pipe and numerous complementary inputs. The beneficiaries, those in the aluminum industry, have utilized their retained earnings to diversify production downstream. In a number of cases, they have extended their focus from natural resource production to processing. Cumulative multiplier effects have followed in many sectors. Russia’s real GDP grew by 10 percent in 2000, an increase of $70.6 billion from 1999 (Table 1.1). Its energy exports grew by 10.3 percent in 2000, an increase of $21.8 billion from 1999.19
The third phase of the post-crisis transition, which began in the third quarter of 2000 and has been ongoing for more than five years, represents a continuation of the second phase, benefiting now from the considerable politico-economic stabilization promoted by President Putin; however, as will be shown, the second half of 2004 brought about some serious setbacks.
When Putin was named prime minister in 1999, as already noted, economic conditions in Russia were beginning to improve, although the nation was still in a perilous state. His own judgment on the conditions of the time was revealed in his comment, “If I can help save Russia from collapse, then I’ll have something to be proud of.”20
Widespread predictions to the contrary notwithstanding, the Central Bank of Russia (CBR) had made strong efforts – with considerable success – to rein in the inflationary pressures associated with the economic crisis of 1998. But the CBR was substantially beholden to myriad vested interests in the Duma that were promoting enlarged government expenditures. A marked improvement in financial conditions could not be achieved without cutting federal discretionary expenditures and improving compliance with the tax laws. Putin initiated comprehensive investigations to serve as a basis for such actions.
The evidence indicates that, even though banking reforms have seriously lagged behind schedule, from the time Putin became prime minister, the consumer price index (CPI) has been brought under control more effectively. On a seasonally adjusted basis, the average monthly CPI increase has been reduced to about 1 percent per month.21 The fiscal system has been fundamentally and successfully transformed. In particular, the reduction of the income tax to a flat 13 percent and the corporate tax from 34 to 24 percent has had a spectacular effect on increasing tax compliance. Suffice it to note here that, from 1999 to 2001 Q3, government expenditure as a percentage of GDP was reduced by 2.6 points; government revenue as a per...
Table of contents
- Cover Page
- Title Page
- Copyright Page
- Illustrations
- Preface
- 1 Russia’s Economic Restructuring Since the 1998 Crisis
- 2 Transitional Constraints
- 3 Basic Principles Toward a Successful Russian Market Economy
- 4 Policy Reforms for the Longer Term
- 5 The Yukos Crisis
- 6 Transitional Tensions and Permanent Interests
- 7 Concluding Observations
- Appendices
- Notes
- Bibliography
Frequently asked questions
Yes, you can cancel anytime from the Subscription tab in your account settings on the Perlego website. Your subscription will stay active until the end of your current billing period. Learn how to cancel your subscription
No, books cannot be downloaded as external files, such as PDFs, for use outside of Perlego. However, you can download books within the Perlego app for offline reading on mobile or tablet. Learn how to download books offline
We are an online textbook subscription service, where you can get access to an entire online library for less than the price of a single book per month. With over 1.5 million books across 990+ topics, we’ve got you covered! Learn about our mission
Look out for the read-aloud symbol on your next book to see if you can listen to it. The read-aloud tool reads text aloud for you, highlighting the text as it is being read. You can pause it, speed it up and slow it down. Learn more about Read Aloud
Yes! You can use the Perlego app on both iOS and Android devices to read anytime, anywhere — even offline. Perfect for commutes or when you’re on the go.
Please note we cannot support devices running on iOS 13 and Android 7 or earlier. Learn more about using the app
Please note we cannot support devices running on iOS 13 and Android 7 or earlier. Learn more about using the app
Yes, you can access Russia Moves into the Global Economy by John M. Letiche in PDF and/or ePUB format, as well as other popular books in Business & Business General. We have over 1.5 million books available in our catalogue for you to explore.