- 192 pages
- English
- ePUB (mobile friendly)
- Available on iOS & Android
eBook - ePub
About this book
A new and incisive analysis of the political viability of human rights, with an in-depth investigation of its largest violation: world hunger.
Gonzalez-Pelaez develops John Vincent's theory of basic human rights within the context of the international political economy and demonstrates how the right to food has become an international norm enshrined within international law. She then assesses the international normative and practical dimensions of hunger in connection with international trade and poverty. Using the society of states as the framework of analysis, she explores the potential that the current system has to correct its own anomalies, and examines the measures that can move the hunger agenda forward in order to break through its current stagnation.
Trusted by 375,005 students
Access to over 1.5 million titles for a fair monthly price.
Study more efficiently using our study tools.
Information
Subtopic
Political Economy1 The problem of hunger
This chapter examines the size and shape of the problem of hunger and provides the empirical evidence used in the subsequent chapters to assess the right to food in international society. The first section defines key terms involved in the hunger discourse. The second presents the global statistics on ‘hunger’ from the 1990s (with highlights from the 1980s and 1970s) and reveals the dynamics of the problem. The third section investigates the disputed causes of the problem, highlighting the debate that occurs on both national and international levels. Section four concentrates on how international trade can cause hunger, paying special attention to agricultural trade.
The analysis in this chapter provides the necessary background to assess John Vincent’s claim that routine starvation arises from the existing structure of the international economic system and constitutes the ‘resident emergency’ of international society. His theory of basic rights develops on the basis of this claim, examined here in Chapter 2. A critical assessment both of the phenomenon of hunger and of Vincent’s theory is made later in the book (Chapters 3, 4 and 5).
Definitions
There are several key concepts that are used in the language of food-related problems. These terms set out different analytical perspectives in the process of collecting statistics and organising the data obtained (definitions from FAO, 1999b: 11 and Parker, 2003: 1):
• Food security refers to people’s ability to have economic and physical access to food that can be properly utilised to ensure adequate nutrition. ‘Food security’ suggests that people have enough to eat but it does not address who produces it or how.
• Food insecurity is characterised by a low level of food intake, which can be transitory (when it occurs in times of crisis), seasonal or chronic (when it occurs on a continuing basis).
• Hunger or undernourishment refers to an insufficient supply or, at worst, a complete lack of calories. It is a stage of chronic food insecurity in which food intake is insufficient to meet basic energy requirements on a continuing basis.
• Malnutrition is characterised by the lack or shortage of micronutrients (vitamins and minerals) in food that provides enough calories. It is a physiological condition resulting from inadequacy or imbalance of food intake or from poor absorption of food consumed. These micronutrients are vital for the functioning of cells, especially the nervous system. The lack of them in the first five years of a child’s life can cause death, or disability for life.
Undernourishment and malnutrition are two sides of the same coin: the lack of food security and its devastating consequences for human survival and wellbeing. Statistics and different studies on this matter refer to ‘hunger’ or ‘the hungry’, meaning both groups. By the same token, in this book I also mean both undernourishment and malnutrition when using the terms ‘hunger’ or ‘hungry’. Other relevant definitions are:
• Vulnerability, involving the presence of factors that place people at risk of becoming food insecure or malnourished.
• Based on these concepts, a new term has been introduced recently for practical reasons when calculating the state of food insecurity in the world: depth of hunger. This is a measure in calories of the ‘per person food deficit’ of the undernourished population within each country or area. Therefore, where the undernourished lack 400 calories a day, the situation is more dire than where the average shortage is 100 calories. The healthy average is calculated to be around 2,700 calories per day, although it varies depending on level of activity, age and gender (FAO, 14/1/02c: 1, 2).
The focus of this research will be the hungry in general. This terminology will help to determine the grade of undernourishment experienced by people in these circumstances.
Statistics: size and shape of the problem
This section begins by sketching the general background of the problem of hunger in absolute terms. Then I analyse the trends that these statistics display and establish the dynamics of hunger, considering both absolute and proportional figures (evolution of undernourishment in relation to population growth). The time frame for this study is mainly the decade of the 1990s to the present. Flashbacks into the 1980s and 1970s are provided in order to establish the dimensions of the problem at the time when Vincent wrote his work and their evolution since then.
Statistics on food security date back to the late 1960s as a preparation for the first hunger-related summit: the World Food Conference in 1974 (FAO, 1996b: 1–15). However, it is not until the 1990s that exhaustive data become available. The World Food Summit (1996) led to the creation a year later of the Food Insecurity and Vulnerability Information and Mapping Systems (FIVIMS), a complex data collection mechanism. It consists of networks of systems that assemble, analyse and disseminate information about the problem of food insecurity and vulnerability at both global and national levels. The Food and Agriculture Organisation (FAO) has an ongoing project for monitoring the nutritional status of populations worldwide. Its statistics are accepted by governments around the world and formed the basis for the World Food Summit in 1996.
This summit is the crucial date for international action against hunger where governments agreed on several commitments intended to halve the number of hungry people by 2015 (taking as a point of reference the global 818 million that there were in the developing world in 1990–92, the benchmark period used at the World Food Summit). The FAO’s major contribution to the plan is The State of Food Insecurity in the World, published on an annual basis since 1999. The average annual decrease required to meet the 2015 target would have been 22 million per year since 1996 in absolute numbers, which differs dramatically from the trend maintained in the decade of the 1990s, where a 2.5 million reduction per year was registered (FAO, 2003: 6). This figure corresponds to an annual average established in estimate terms; this does not mean that the reduction has been constant. There might be years when it has reached higher or lower levels. There are no statistics that monitor the year-to-year variations in the hunger levels (Mernies, 2002).
Because the data collection system is itself still under development, figures can change dramatically from one yearly report to the next. The 1990–92 data were used as a benchmark for the 1996 summit and do not vary, but the figures after that have been constantly revised. Despite these continuous reviews of the numbers, the statistics provide a map of the areas of the world where the hunger spots are localised.
In these general terms, from 1990 to 1999 there was a net reduction of 20 million hungry people in the developing world, calculated on the basis of the reduction of 116 million that the best performing countries experienced and the 96 million increase that 47 countries suffered (FAO, 17/10/02: 8).
The causes of hunger are spread across different levels and their impact varies among countries. During the past two decades, the global per capita availability of food has increased despite a population growth of 1,600 million. The average energy supply rose from 2,410 calories in 1969–71 to 2,800 calories in 1997–99 in the world as a whole and from 2,110 to 2,680 calories in developing countries (FAO, 14/1/02k: 1). However, the absolute number of undernourished in the developing world only went down from 956 million in 1969–71 to 798 million in 1999–2001 (FAO, 2003: 6).
These figures contrast with another fact calculated by the FAO: at the present stage of development of agricultural production, the Earth could feed 12 billion human beings, providing food equivalent to 2,700 calories a day for every individual. And yet there are only 6 billion people currently living on the planet. On average 62 million die a year; out of those, 36 million die from hunger-related diseases (UN, 2001d: 5), of whom 9 million die from starvation itself (De Haen, 2002: 1).
Most of the victims live in the more than 80 nations classified as low-income food-deficit countries (LIFDCs), many of which cannot produce enough food to feed their population and lack the financial resources to import the extra supplies they need (CFS, 2002a: 3). By regions, Table 1.1 shows how the undernourishment map looks.
Asia has the largest number of undernourished people, 508 million, which is 16 per cent of the total population of the continent. Asia’s number of hungry people in the 1970s was equivalent to 41 per cent of the population. Even when the region’s population has increased during the past two decades by 800 million, the number of undernourished people was reduced to 16 per cent of the total population. Within that region, East and South East Asia are the best performers, while South Asia is one the three worst affected areas in the world, with 24 per cent of its population being hungry. The other two major hunger spots are Sub-Saharan Africa and the Caribbean (FAO, 2003: 31).
Table 1.1 Proportion of undernourished in the developing world
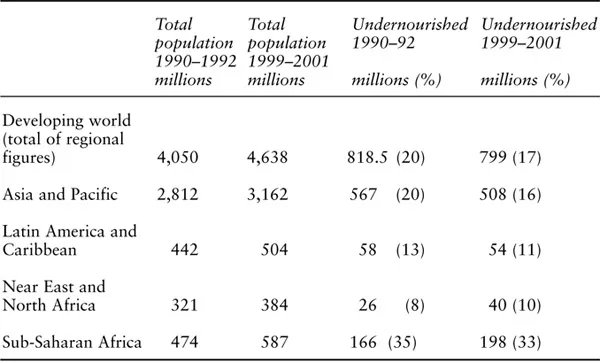
Source: Adapted from FAO, The State of Food Insecurity in the World 2003.
Looking at the number of victims in relation to the size of the population, Sub-Saharan Africa is at present the worst affected area in terms of percentage of the total population: 198 million people, 33 per cent of the total population, are permanently undernourished. Most of them suffer from ‘extreme hunger’, with an average daily intake of 300 calories less than the minimum quantity required for survival.
Therefore, and in relation to the definitions provided earlier, there are more chronically hungry people in Asia and the Pacific, but the depth of hunger is greatest in Sub-Saharan Africa. There, in 46 per cent of the countries, the undernourished have an average deficit of more than 300 calories per person per day. However, in Asia and the Pacific only 16 per cent of the undernourished suffer from food deficits this high (FAO, 2000b: 3, 4; FAO, 17/10/02: 31–5; FAO, 2003: 32).
When the number of undernourished people is viewed by areas (Table 1.1) there is a generally decreasing trend, considering that there has also been a substantial growth of population. However, these results benefit from the progress made in large countries. China registered a decrease in the number of undernourished people from 16 per cent of its total population in 1990 to 9 per cent in 2000, together with an increase of its total population by 90 million. Indonesia went down from 9 per cent in 1990 to 6 per cent in 2000, having also registered an increase in population of 20 million. Nigeria reduced its 14 per cent of undernourished people in 1990 to 7 per cent in 2000 while its population went up by nearly 20 million (FAO, 9/4/00j: 2–5; FAO, 17/10/02: 30, 31).
In proportional numbers, between 1990 and 2000 the number of undernourished fell in the majority of developing countries, although in some areas the decrease has not been sufficient to compensate for the population growth. In total, 61 developing countries achieved a proportional decrease during this period, although in 26 of them it was not sufficient to cover the population growth. That is the case in Angola, Chad, India and Mozambique, which, because of their high population growth, did not manage to reduce the number of undernourished significantly in absolute numbers despite their performance (FAO, 2001b: 1–3). For example, in India the absolute numbers of undernourished have increased by 18 million, although the proportional numbers fell from 25 to 14 per cent (FAO, 17/10/02: 8).
Table 1.2 shows the average rate of population growth by taking four years as an example; although the percentages have started to decrease, the trend is still not strong enough to determine the direction it will take.
In terms of the 2015 deadline, the picture is mixed and subject to individual country analysis. In the 1990s, 22 countries (including Bangladesh, China, Haiti and Mozambique) managed to achieve substantial progress in their traditionally alarming records.
Table 1.2 Rate of population growth (percentage)
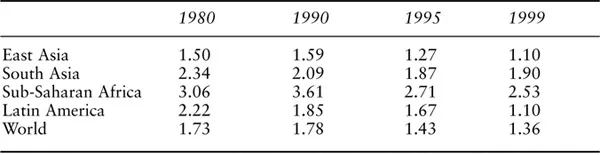
Source: Adapted from ‘Data for the Analysis of Poverty Reduction’, World Bank (7/2/2002a).
However, and in terms of the region as a whole, improvement does not look as clear in Sub-Saharan Africa. This region is made up of the world’s poorest countries, and rapid economic growth there is unlikely. Undernourishment is expected to decline from 33 per cent in 1998 to 22 per cent in 2015. High population growth has a negative effect and the number of hungry people could even increase. Some very poor countries in Asia, the Caribbean and the Near East share similar characteristics (FAO, 14/1/02c: 2). The prospective rate of population growth is calculated on the basis of the current patterns, although they could be altered by increased use of contraceptive methods in the developing world, changes in cultural patterns regarding fertility or the rising number of deaths from AIDS, which has reached epidemic levels in parts of Africa and Asia. Even then, estimates maintain that the world population will grow from 5.3 billion in 1990 to 8.9 billion in 2030, with the highest rate of increase located in the developing world (Thomas, 1997: 462).
* * *
In the light of the statistics just presented, it can be said that despite regional differences, hunger is a phenomenon found all over the developing world with higher incidence in parts of Africa, South Asia and parts of Latin America and the Caribbean. In absolute terms, there has been a reduction in the past two decades in the number of hungry people, considering that the population went up by over 1.5 billion. The general outlook by region is improving, helped mainly by large countries that have experienced a strong reduction. However, when looking at countries on an individual basis, the picture is mixed, with a rapid reduction in some of them and a slow reduction or none in others.
The net decrease amounts to 20 million (in the 1990s), which is not sufficient to meet the heads of states’ commitment to eradicate hunger by 2015. In terms of proportional numbers, the growth of population tends to overshadow improvements in hunger reduction, especially in very poor countries. In fact, the annual rate of reduction would need to be accelerated to 26 million per year, more than 12 times the current rate. However, population increase is not the only determining factor. There are countries that have seen a substantial population growth and still reduced both the absolute and proportional numbers of undernourished.
Causes of the problem
This section outlines the major areas of dispute in the literature on the causes of hunger. The purpose of this survey is to highlight the main themes of the multidimensional debate in order to locate the route followed in the book. Each theme is highly contested both internally (arguments in favour and against) and externally (the priority they should be given in relation to the other causes involved). I sketch the main lines of the debate that frame the problem of hunger, before focusing on Vincent’s approach, but I do not attempt to resolve these disputes or to take sides.
The account given here embraces both national and international causes of hunger, although in some cases there are no clear boundaries and they can overlap at various points. The factors considered here are overpopulation, food distribution, access to land and credit, discrimination against women, corruption, wars, external debt, poverty, developments in biotechnology, and world trade.
Overpopulation
The first school of thought in the debate about hunger places central importance on the relationship between human population growth and the food supply. It is known as the orthodox, nature-focused explanation of hunger and asserts that population growth shadows the increases in food production. This explanation identifies overpopulation as the cause of hunger and explores possible ways to reduce human fertility in the fastest growing section of the world, the poor of the ‘Third World’. In particular, the most populous countries are Bangladesh, Brazil, China, Egypt, Ethiopia and Eritrea, India, Indonesia, Iran, Mexico, Nigeria and Pakistan. They account for half of the world’s population and their rate of growth is expected to increase over the next decades, which will make the reduction of hunger very difficult (Thomas, 1997: 462).
Food distribution
Food distribution is the main factor for a second school of thought that opposes the previous approach. Its advocates construct their argument around the idea that there has been an enormous increase in food production since the Second World War, thanks to the development of seeds and agricultural technology. However, this increase has m...
Table of contents
- Cover
- Title
- Copyright
- Contents
- List of tables
- Series editor’s preface
- Acknowledgements
- List of abbreviations
- Introduction
- 1 The problem of hunger
- 2 Basic human rights: political origins
- 3 Basic rights in international society: the right to food
- 4 International trade and the options for eradicating hunger
- 5 Can international society eliminate hunger?
- 6 Conclusion: assessment of Vincent’s basic rights project
- Notes
- Bibliography
- Index
Frequently asked questions
Yes, you can cancel anytime from the Subscription tab in your account settings on the Perlego website. Your subscription will stay active until the end of your current billing period. Learn how to cancel your subscription
No, books cannot be downloaded as external files, such as PDFs, for use outside of Perlego. However, you can download books within the Perlego app for offline reading on mobile or tablet. Learn how to download books offline
Perlego offers two plans: Essential and Complete
- Essential is ideal for learners and professionals who enjoy exploring a wide range of subjects. Access the Essential Library with 800,000+ trusted titles and best-sellers across business, personal growth, and the humanities. Includes unlimited reading time and Standard Read Aloud voice.
- Complete: Perfect for advanced learners and researchers needing full, unrestricted access. Unlock 1.5M+ books across hundreds of subjects, including academic and specialized titles. The Complete Plan also includes advanced features like Premium Read Aloud and Research Assistant.
We are an online textbook subscription service, where you can get access to an entire online library for less than the price of a single book per month. With over 1.5 million books across 990+ topics, we’ve got you covered! Learn about our mission
Look out for the read-aloud symbol on your next book to see if you can listen to it. The read-aloud tool reads text aloud for you, highlighting the text as it is being read. You can pause it, speed it up and slow it down. Learn more about Read Aloud
Yes! You can use the Perlego app on both iOS and Android devices to read anytime, anywhere — even offline. Perfect for commutes or when you’re on the go.
Please note we cannot support devices running on iOS 13 and Android 7 or earlier. Learn more about using the app
Please note we cannot support devices running on iOS 13 and Android 7 or earlier. Learn more about using the app
Yes, you can access Human Rights and World Trade by Ana Gonzalez-Pelaez in PDF and/or ePUB format, as well as other popular books in Politics & International Relations & Political Economy. We have over 1.5 million books available in our catalogue for you to explore.