![]()
1
HELLO ANALYTICS!
CHAPTER 1
ANALYTICS OR DIE
CHAPTER 2
WHAT IS ANALYTICS?
CHAPTER 3
TOP SEVEN ANALYTICS
METHODOLOGIES
![]()
ONE
Analytics or Die
THIS CHAPTER WILL TALK ABOUT:
Why analytics? Because you can’t depend on chance.
What is analytics?
Circuit City,1 a dominant big box electronic retailer in the United States, grew throughout the 1980s and 1990s, as it established an empire of stores in strategic locations from coast to coast. In August 2008, Circuit City’s biggest rival, Best Buy, reported increased sales and a quarterly profit of $200 million. That same quarter, Circuit City reported a loss of $239 million.2 On March 9, 2009, Circuit City shuttered the last of its 567 retail stores.
The magic had ended. But what had happened?
In the late 1990s, growth of web commerce was projected at 2300 percent. Best Buy brought its website to the world in 2000. Circuit City didn’t.
In 1999, Circuit City announced $1.6 billion in annual sales revenue from large appliances, second only to Sears. In 2000, it decided to stop selling appliances to save on warehouse storage and delivery costs. The housing boom of the mid-2000s saw the largest home appliance sales since the mid-1800s, when home appliances first appeared. Circuit City had missed the wave.
By 2004, Best Buy had secured “A” quality locations, whereas Circuit City opted for low-cost leases in distant locations to save on rent. Consumers flocked to stores they could get to in a 10-minute car ride.
Circuit City let go of its highest paid sales personnel from local stores to reduce the cost of manpower, while maintaining the employee head count in stores. Many of these well-paid sales associates were the company’s best, generating the greatest revenue, and most loyal, having stayed through the company’s growing pains. They took their skills and experience to Best Buy and other competitors.2
Many strategic missteps contribute to the fall of any corporate giant. The factors above are those that could have been addressed through the power of data analytics. Keeping an eye on growth projections from the industry and a competitor’s adoption of emerging technologies would have informed Circuit City to boost its online presence. In deciding to cut costs, an ROI analysis would have stopped the company from firing its highest paid employees who were bringing in disproportionately higher revenue. If Circuit City had analyzed the data to balance supply and demand to inform its inventory management, its leaders wouldn’t have undertaken these illogical cost-cutting exercises to cover the debt from unsold inventory. Management made two critical decisions company-wide to reduce costs: (1) to close its appliance business and (2) to move its retail locations to “B,” or suburban, locations. Data may have indicated that this is where the main costs lie, but the decisions were not properly tested. Reducing appliance inventory and observing the performance of a few test stores in the “B” locations first would have disproved these strategies, saving the company from closing its lucrative appliance business and moving into the suburbs, thereby losing its clientele.
Analytics is not just about data, but about decisions. If Circuit City had leveraged data analytics effectively and made good decisions based on them, the company might still be in business.
WHAT IS ANALYTICS?
Analytics is the science of applying a structured method to solve a business problem using data and analysis to drive impact. Many businesses grapple with strategic business problems like cost cutting and business innovation. Initiatives to tackle such problems tend to shake up budgets and organizational structures. Data analytics can be a powerful tool in these decisions. The right analytics approach is an informed solution backed by data and insights.
Intuition + Data = Powerful insights → Good decision
Not just insights, but actionable insights—the kind that promote new thought processes, drive decision making, and impel positive action. Industry leaders like Procter & Gamble, Amazon, LinkedIn, and Capital One have dominated their fields by deploying data-led, hypothesis-driven, and analytics-powered strategies backed by vision and intuition. We will talk about these methods in this book.
Welcome to the world of business analytics.
The year 2011 saw Procter & Gamble record over $82.6 billion in sales.3 Fortune magazine placed P&G at fifth place on the “World’s Most Admired Companies” list, up from sixth place the previous year.
With 127,000 employees worldwide and 300 brands sold in 180 countries, how has P&G managed to lead the household goods industry over the 177 years of its existence—since 1837? This $140 billion conglomerate consumer goods company has contextually reinvented itself over time using a hypothesis-driven analytics strategy to stay relevant and fuel the edge.
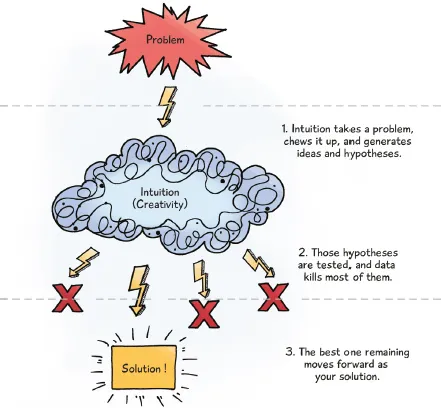
What is hypothesis-driven analytics? Imagine swimming the Pacific Ocean to find gold. Wouldn’t you rather narrow down the most likely areas where gold could be, so you wouldn’t have to cover every square inch of water from China to America?
Similarly, data is an ocean, and hypotheses help to narrow down where to find the most likely answers. Hypotheses are generated by human intuition based on the collective intelligence and experience of stakeholders and their understanding of the business and their environment. Data validates the hypotheses to come up with a convergent solution. The strength of the solution then will lie in the best of both—data and hypotheses.
How does hypothesis-driven analytics strategy work?
It starts with answering a set of plain sounding questions, “What is happening?” and “Why is it happening?” These simple questions have helped companies like P&G identify actions that can be taken to address a situation. Action without insight means decisions are made without any perspective on which paths would yield results.
In 2010, P&G CEO Bob McDonald strategized to digitize the company’s processes end-to-end to achieve business optimization and decision efficiency using analytics. But P&G was simultaneously tasked with cutting costs. By 2012, it had eliminated 1,600 nonmanufacturing jobs, and its IT organization had cut over $900 million in total expenditure. Despite reducing headcount and expenses, P&G managed to score an increase in gross revenue.
How? P&G invested in analytics expertise to develop its capabilities to make wise and timely decisions in unpredictable and stressful environments.4 Its analytics provided predictions about P&G market share and other performance statistics up to a year into the future. At the core of this capability was a series of analytic models that reveal events in the business as they occur, including peaks and valleys in performance, identify reasons why they occur, and point to actions P&G can take to leverage or mitigate effects from these events.
P&G’s analytics is driven by a cultural mindset to ask questions and propose hypotheses before delving into complex data analytics. “What” monitors areas like shipments, sales, and market share to keep an eye on the key metrics for the business. When exceptions occur, “Why” drills down to the drivers—country, territory, product line, and store levels—to understand the specifics behind what is happening. Analytics then identifies “action levers” that P&G can pull, such as pricing, advertising, and product mix, and provides estimates of what that action can potentially deliver. By efficiently establishing the whats and the whys, decision makers at P&G have been able to jump right into solving a problem, radically increasing efficiency and the pace of conducting business.
This strategy surely works for giants like P&G. Now, how can You, facing an...