How can geckoes walk on the ceiling and basilisk lizards run over water? What are the aerodynamic effects that enable small insects to fly? What are the relative merits of squids' jet-propelled swimming and fishes' tail-powered swimming? Why do horses change gait as they increase speed? What determines our own vertical leap? Recent technical advances have greatly increased researchers' ability to answer these questions with certainty and in detail.
This text provides an up-to-date overview of how animals run, walk, jump, crawl, swim, soar, hover, and fly. Excluding only the tiny creatures that use cilia, it covers all animals that power their movements with muscle--from roundworms to whales, clams to elephants, and gnats to albatrosses. The introduction sets out the general rules governing all modes of animal locomotion and considers the performance criteria--such as speed, endurance, and economy--that have shaped their selection. It introduces energetics and optimality as basic principles. The text then tackles each of the major modes by which animals move on land, in water, and through air. It explains the mechanisms involved and the physical and biological forces shaping those mechanisms, paying particular attention to energy costs.
Focusing on general principles but extensively discussing a wide variety of individual cases, this is a superb synthesis of current knowledge about animal locomotion. It will be enormously useful to advanced undergraduates, graduate students, and a range of professional biologists, physicists, and engineers.
- 384 pages
- English
- ePUB (mobile friendly)
- Available on iOS & Android
eBook - ePub
Principles of Animal Locomotion
About this book
Trusted by 375,005 students
Access to over 1.5 million titles for a fair monthly price.
Study more efficiently using our study tools.
Information
Publisher
Princeton University PressYear
2013Print ISBN
9780691126340
9780691086781
eBook ISBN
9781400849512
Chapter One
The Best Way to Travel
THIS BOOK describes the movements of animals and of the structures such as legs, fins, or wings that they use for movement. It tries to explain the physical principles on which their movements depend. And it asks whether the particular structures and patterns of movement that we find in animals are better suited to their ways of life than possible alternatives. This chapter will, I hope, help us when we come to ask these questions about the merits of particular structures and movements.
The structures of animals and some of their patterns of movement (the ones that are inherited) have evolved. Other patterns of movement may be learned afresh by successive generations of animals, by trial and error. Evolution by natural selection, and learning by trial and error, both tend to make the animals and their behavior in some sense better. What, in this context, does “better” mean?
1.1. FITNESS
The most fundamental answer is that evolution favors structures and patterns of movement that increase fitness, and that the capacity for learning has evolved so that learning also can be expected to increase fitness. The fitness of an animal’s complement of genes (its genotype) is the probability of the same group of genes being transmitted to subsequent generations. Unfortunately for the purposes of this book, it is not generally easy to measure or calculate the effect on fitness of, for example, a change in the length of an animal’s legs or a modification of its gait. We can make more progress by looking at the effects of evolution in a less fundamental way.
Fitness depends largely on the number of offspring that animals produce, and on the proportion of those offspring that survive to breed. Thus, natural selection favors genotypes that increase fecundity or reduce mortality. This insight still seems rather remote from our discussions of locomotion. It seems helpful to ask at this stage, what aspects of an animal’s performance in locomotion are most likely to affect fecundity and mortality, and so fitness? What qualities, in the context of locomotion, can natural selection be expected to favor? Some suggestions follow.
1.2. SPEED
For many animals, natural selection may tend to favor structures and patterns of movement that increase maximum speed. A faster-moving predator may be able to catch more prey, which may enable it to rear and feed more offspring. A faster moving prey animal may be better able to escape predators, and so may live longer. However, we should not assume that speed is important for all animals. For example, tortoises are herbivores, with no need for speed to catch prey. Their shells are sufficient protection against most predators, so they do not need speed to escape. It seems clear that maximum speed has had little importance in the evolution of tortoises, so we need not be surprised that tortoises are remarkably slow.
It is probably generally true that most animals spend very little of their time traveling at maximum speed. Lions (Panthera leo) are idle for most of the day, but their ability to run fast occasionally is vital to their hunting success. The antelopes and zebra on which they feed spend nearly all their time quietly grazing or traveling slowly, but depend on their ability to run fast in emergencies, to escape from lions and other predators. Ability to travel fast may be highly important to animals, although it may seldom be used.
1.3. ACCELERATION AND MANEUVERABILITY
Acceleration may be even more important than speed for predators such as lions, which stalk antelopes and then make a sudden dash from a short distance; and pike (Esox), which hide among vegetation and dash out to catch small fish that swim past. Acceleration must be correspondingly important for the prey. Suppose a predator dashes with constant acceleration apred, starting from rest at zero time, at a distance d from its prey. At time t its speed is apredt, and it has traveled a distance 0.5apredt2. If the prey starts running at the same instant as the predator, with acceleration aprey, it has traveled a distance 0.5apreyt2 at time t. If the predator’s acceleration is greater than the prey’s, and if the chase is short enough for neither animal to reach top speed, the predator catches the prey when
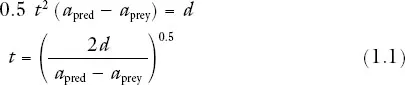
by which time the predator has covered a distance apredd/(apred − aprey). If the predator has twice the acceleration of the prey, it catches it after covering a distance 2d; but if its acceleration is only 1.1 times that of the prey it has to run a distance 11d.
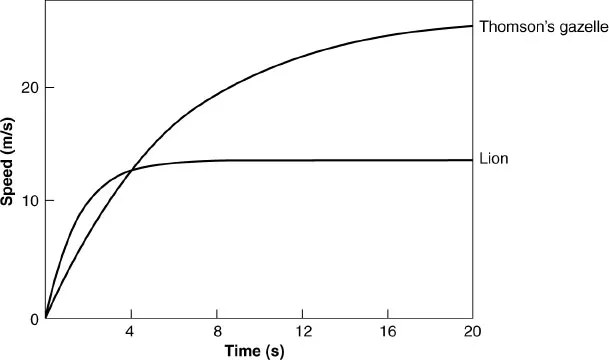
Fig. 1.1. Graphs of speed against time for lions and Thomson’s gazelle, calculated from films of lions attacking prey. The curves were obtained by fitting to the data equations of the form v = vmax [1 − exp (− kt)], where v is the speed at time t, vmax is the speed that is approached asymptotically, and k is a constant. Redrawn from Elliott et al. (1977).
That analysis is grossly simplified. It assumes that both animals start moving simultaneously, and that both animals have constant acceleration throughout the chase. Elliott et al. (1977) filmed lions hunting gazelles (Gazella thomsoni), and used his films to calculate graphs of speed against time. These graphs curve and level off, showing that both predator and prey accelerated at decreasing rates, as they gained speed (Fig. 1.1). However, the analysis is sufficient to show that the ability of a predator to catch prey may depend more on its acceleration than on its maximum speed. Indeed, a predator with superior acceleration may be able to catch prey, even if its top speed is lower than that of the prey. Elliott found that the initial accelerations of the lions averaged 9.5 m/s2, and those of the gazelles only 4.5 m/s2. He estimated that the speeds they would eventually have reached were 14 m/s for the lions, and a much faster 27 m/s for the gazelles. However, these estimates of top speed depended on extrapolation of his data, and may not be accurate.
The analysis also ignored the possibility that the prey might attempt to escape by swerving. Films of gazelles (Gazella thomsoni again) pursued by cheetah (Acinonyx jubatus) show the prey swerving when the predator is close behind. Children playing the game of tag (called tig in Britain) know that a well-timed swerve is a good escape strategy.
An animal traveling at speed v on a circular arc of radius r has an acceleration v2/r toward the center of the circle. Thus, swerving involves sideways acceleration. Suppose that a predator running at speed vpred is capable of swerving with radius rpred, and a prey animal running with speed vprey swerves with radius rprey. The prey can escape, even if vprey is lower than vpred, if its sideways acceleration vprey2/rprey is greater than the predator’s sideways acceleration vpred2/rpred. Howland (1974) pointed this out, and went on to show that, to take full advantage of its superior sideways acceleration, the prey must delay swerving until the predator is very close behind. This is illustrated in Fig. 1.2, which shows the paths of predator and prey. The predator is represented as traveling faster than the prey, but with larger radius. Time intervals are marked on the animals’ paths. Each animal has the same speed and radius in both diagrams. The prey escapes if it swerves at the last possible moment (B), but if it swerves too soon the predator cuts off the corner and intercepts it (A).
1.4. ENDURANCE
Animals cannot maintain their top speeds indefinitely in a prolonged chase. Figure 1.3A shows the speeds at which human athletes have run races ranging from a 100-m sprint to a marathon, plotted against the time taken for the race. Figure 1.3B shows the maximum speeds maintained by trout (Salmo irideus) for different times. In each case speed falls as time and distance increase.
The graph for the fish (Fig. 1.3B) is plotted on ordinary linear coordinates. It shows, for example, that the 15-cm fish’s maximum speed was 180 cm/s for one-second sprints, but fell, as time increased, toward an asymptote of about 40 cm/s. The graph for human running (Fig. 1.3A) would look very similar to the fish graph, if it had been plotted in the same way. However, it has been plotted on logarithmic coordinates, which have made it possible to display data for a much wider range of times. This graph shows not only that maximum speed declines markedly in the first 100 s of running time, but also that the decline continues over a period of several hours. The point for the 100-m race (triangle) is potentially misleading because sprinters are still accelerating over most of this distance. The remaining data, for races from 200 m to a marathon, form two straight lines meeting at an angle when plotted thus on logarithmic coordinates. This suggests that the decline in speed over short times (less than about 150 s) depends on a different phenomenon from the longer term decline in speed. We will find a likely explanation in Section 2.5.
Now suppose that a predator is chasing prey over a sufficient distance for us to ignore the acceleration period. We might, for example, be considering African hunting dogs (Lycaon), which chase antelopes over distances of several kilometers (van Lawick-Goodall and van Lawick-Goodall 1970). Assume that both animals are able to estimate the duration of the chase in advance, and choose the speeds that will take them furthest in that time. Though its sprinting speed may be less than that of the prey, the predator will eventually overtake the prey if its sustainable speed is greater than that of the prey. Less obviously, even though its sprinting speed and its maximum speed over long distances may be less than those of the prey, it may be able to catch the prey if it fatigues less quickly than the prey. Figure 1.3C is a schematic graph illustrating this possibility; notice how the lines cross, showing that there is a range of chase times for which the predator can travel faster than the prey.
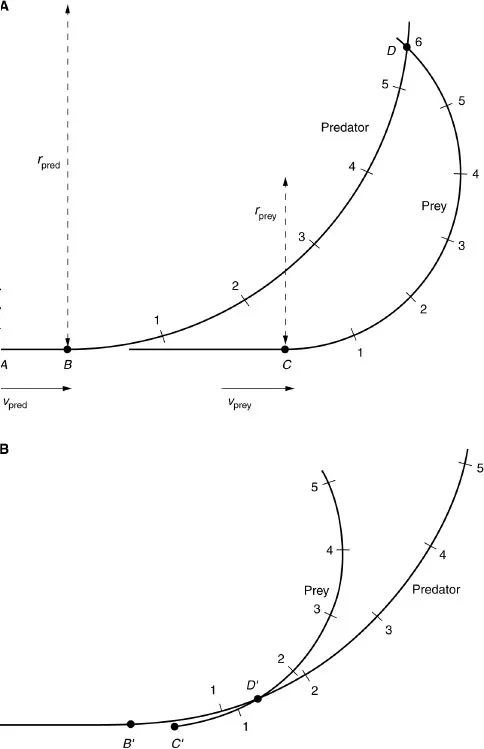
Fig. 1.2. Diagrams of a predator chasing swerving prey. The paths of the animals are seen in plan view, with the animals’ positions after successive intervals of time numbered 1, 2, etc. The prey is slower than the predator (vprey = 0.75vpred), but can execute a tighter turn (rprey = 0.5rpred). In (A) the animals were initially running along the line A...
Table of contents
- Cover Page
- Title Page
- Copyright Page
- Contents
- Preface
- Chapter 1. The Best Way to Travel
- Chapter 2. Muscle, the Motor
- Chapter 3. Energy Requirements for Locomotion
- Chapter 4. Consequences of Size Differences
- Chapter 5. Methods for the Study of Locomotion
- Chapter 6. Alternative Techniques for Locomotion on Land
- Chapter 7. Walking, Running, and Hopping
- Chapter 8. Climbing and Jumping
- Chapter 9. Crawling and Burrowing
- Chapter 10. Gliding and Soaring
- Chapter 11. Hovering
- Chapter 12. Powered Forward Flight
- Chapter 13. Moving on the Surface of Water
- Chapter 14. Swimming with Oars and Hydrofoils
- Chapter 15. Swimming by Undulation
- Chapter 16. Swimming by Jet Propulsion
- Chapter 17. Buoyancy
- Chapter 18. Aids to Human Locomotion
- Chapter 19. Epilogue
- References
- Index
Frequently asked questions
Yes, you can cancel anytime from the Subscription tab in your account settings on the Perlego website. Your subscription will stay active until the end of your current billing period. Learn how to cancel your subscription
No, books cannot be downloaded as external files, such as PDFs, for use outside of Perlego. However, you can download books within the Perlego app for offline reading on mobile or tablet. Learn how to download books offline
Perlego offers two plans: Essential and Complete
- Essential is ideal for learners and professionals who enjoy exploring a wide range of subjects. Access the Essential Library with 800,000+ trusted titles and best-sellers across business, personal growth, and the humanities. Includes unlimited reading time and Standard Read Aloud voice.
- Complete: Perfect for advanced learners and researchers needing full, unrestricted access. Unlock 1.5M+ books across hundreds of subjects, including academic and specialized titles. The Complete Plan also includes advanced features like Premium Read Aloud and Research Assistant.
We are an online textbook subscription service, where you can get access to an entire online library for less than the price of a single book per month. With over 1.5 million books across 990+ topics, we’ve got you covered! Learn about our mission
Look out for the read-aloud symbol on your next book to see if you can listen to it. The read-aloud tool reads text aloud for you, highlighting the text as it is being read. You can pause it, speed it up and slow it down. Learn more about Read Aloud
Yes! You can use the Perlego app on both iOS and Android devices to read anytime, anywhere — even offline. Perfect for commutes or when you’re on the go.
Please note we cannot support devices running on iOS 13 and Android 7 or earlier. Learn more about using the app
Please note we cannot support devices running on iOS 13 and Android 7 or earlier. Learn more about using the app
Yes, you can access Principles of Animal Locomotion by R. McNeill Alexander in PDF and/or ePUB format, as well as other popular books in Biological Sciences & Biology. We have over 1.5 million books available in our catalogue for you to explore.