Many in the United States feel that the nation's current level of economic inequality is unfair and that capitalism is not working for 90% of the population. Yet some inequality is inevitable. The question is: What level of inequality is fair? Mainstream economics has offered little guidance on fairness and the ideal distribution of income. Political philosophy, meanwhile, has much to say about fairness yet relies on qualitative theories that cannot be verified by empirical data. To address inequality, we need to know what the goal is—and for this, we need a quantitative, testable theory of fairness for free-market capitalism.
How Much Inequality Is Fair? synthesizes concepts from economics, political philosophy, game theory, information theory, statistical mechanics, and systems engineering into a mathematical framework for a fair free-market society. The key to this framework is the insight that maximizing fairness means maximizing entropy, which makes it possible to determine the fairest possible level of pay inequality. The framework therefore provides a moral justification for capitalism in mathematical terms. Venkat Venkatasubramanian also compares his theory's predictions to actual inequality data from various countries—showing, for instance, that Scandinavia has near-ideal fairness, while the United States is markedly unfair—and discusses the theory's implications for tax policy, social programs, and executive compensation.
eBook - ePub
How Much Inequality Is Fair?
Mathematical Principles of a Moral, Optimal, and Stable Capitalist Society
- English
- ePUB (mobile friendly)
- Available on iOS & Android
eBook - ePub
How Much Inequality Is Fair?
Mathematical Principles of a Moral, Optimal, and Stable Capitalist Society
About this book
Trusted by 375,005 students
Access to over 1.5 million titles for a fair monthly price.
Study more efficiently using our study tools.
Information
Subtopic
Economic TheoryIndex
Economics
CHAPTER ONE
Extreme Inequality in Income and Wealth
Government of the people, by the people, for the people, shall not perish from the Earth.
ABRAHAM LINCOLN

What improves the circumstances of the greater part can never be regarded as an inconveniency to the whole. No society can surely be flourishing and happy, of which the far greater part of the members are poor and miserable.
ADAM SMITH
1.1 Rise of the Top 1% and Fall of the Bottom 90%
IN RECENT YEARS, there has been growing concern over the widening inequality in income and wealth distributions in the United States and elsewhere (Milanovic 2012; Stiglitz 2012; Piketty and Goldhammer 2014; Krugman 2014; Reich 2015; Stiglitz 2015; Krugman 2015; Atkinson 2015). The statistics are troubling. For instance, as of 2012, the top 1% of households held 41.8% of all wealth in the United States (Saez and Zucman 2014), up from a post–World War II low of about 20% in 1976 (Domhoff 2006). An important source of the wealth inequality is a similar trend in income distribution. Income remains highly concentrated. The top 1% of earners received 17.9% of all income in 2012 in the United States, an increase from 12.8% in 1982 (Domhoff 2006; Piketty and Saez 2003). Income is what people earn from work, but it also includes, if any, dividends, interest, and rents or royalties that are paid to them on assets they own.1 Attendees of the 2015 World Economic Forum in Davos, Switzerland, identified income inequality as the most challenging global trend (Mohammed 2015). There is much discussion in both academic literature and the popular press about what this means, what the consequences are, and what can or should be done about it (Bebchuk and Fried 2005; Jones 2009b; Stiglitz 2012; Mishel et al. 2012; Klinger et al. 2013; Cassidy 2014b; Kristof 2014; Krugman 2014; Piketty and Goldhammer 2014; Reich 2015; Krugman 2015; Atkinson 2015; Mohammed 2015).
In Capital in the Twenty-First Century, economist Thomas Piketty demonstrates these global trends vividly (see figures 1.1 to 1.5). As New Yorker writer John Cassidy observes in his review of Piketty’s 700-page tome (Cassidy 2014a, b), figure 1.1 shows the share of overall income taken by the top 10% of households from 1910 to 2010 in the United States. Generally speaking, the trend is U-shaped, where inequality climbed steeply in the Roaring Twenties and then fell sharply in the decade and a half following the Great Crash of October 1929. From the mid-1940s to the mid-1970s, for about 30 years, it stayed fairly stable, and then it started rising, eventually topping the 1928 level in 2007. It dropped somewhat after the financial crisis in 2007–2008, but by 2015 it had risen again to about 50%.
Figure 1.2 shows the share of income going to the top 1% over the same period. The top line, which includes income of all kinds, has the same U shape. The top percentile hasn’t taken such a large share of overall income since 1928. However, the recent rise is less pronounced when one examines just the wage income (bottom line). The difference between the bottom line (wage income) and the top line (total income) is due to income from capital such as interest payments, dividends, and capital gains. Since the top 1% own a lot of wealth, they receive much of their income in this manner. Nonetheless, the gap in wage income has widened significantly in recent years.
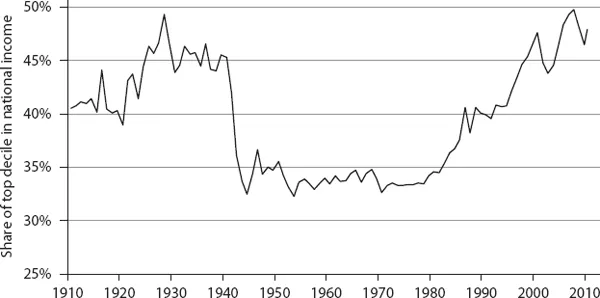
Figure 1.1 Income inequality in the United States from 1910 to 2010 from Piketty and Goldhammer (2014).
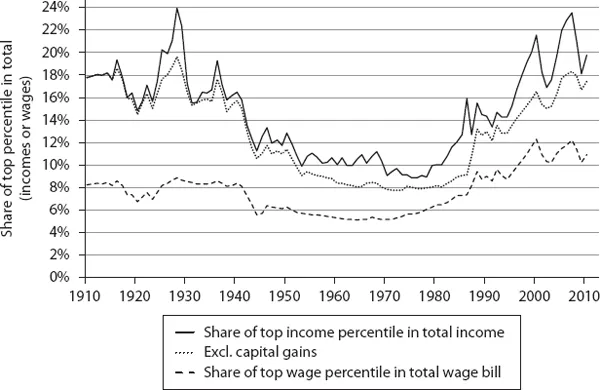
Figure 1.2 Income share of top 1% in the United States from 1910 to 2010 from Piketty and Goldhammer (2014).
Figures 1.3 and 1.4 confirm that this is a global phenomenon. We see it in Australia, Canada, France, Germany, Japan, Sweden, and the United Kingdom. However, the rise in the U curve is less pronounced in Sweden, France, Japan, Australia, and Germany. The United States has the most extreme income inequality now, but this wasn’t the case from 1945 to 1975, when it was more equitable than Canada and on a par with France. The United States was a more economically just society then than it is now.
As noted, extreme inequalities exist in wealth as well. As figure 1.5 shows, the top 1% and top 10% control the lion’s share in European and U.S. societies. For much of the nineteenth and twentieth centuries, Western Europe was dominated by an elite that possessed much of the land and the wealth. The United States also had rich and poor classes, but wealth was distributed a bit more widely. For example, in 1910, the top 10% in Europe owned about 90%; in the United States, the top 10% owned about 80%. However, in recent decades wealth has become more concentrated in the United States than it is in Europe. In 2010, the American 1% owned about 33% of all wealth: the European 1% owned about 25%.
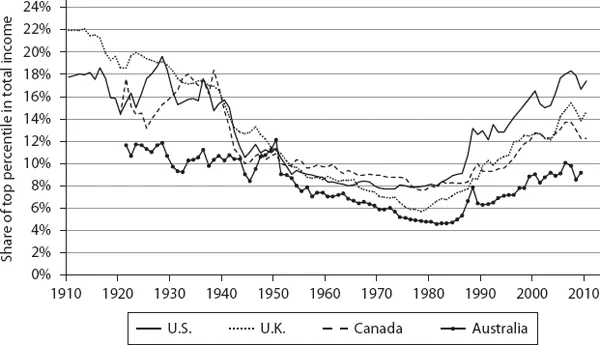
Figure 1.3 Income inequality in Anglo-Saxon countries from Piketty and Goldhammer (2014).
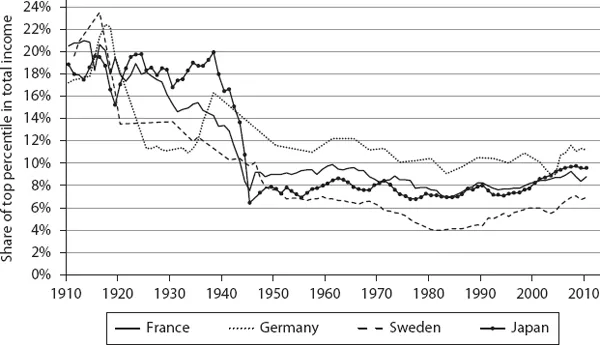
Figure 1.4 Income inequality in continental Europe and Japan from Piketty and Goldhammer (2014).
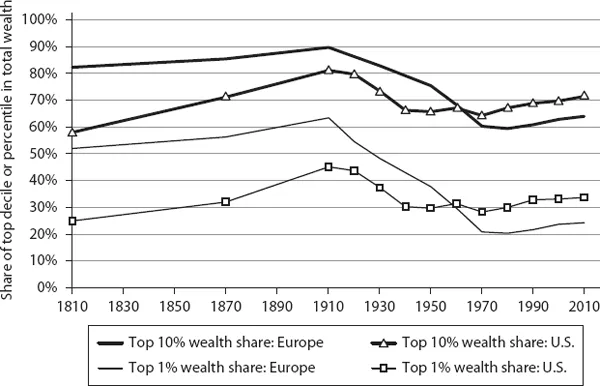
Figure 1.5 Wealth inequality in Europe versus the United States from Piketty and Goldhammer (2014).
1.2 Executive Pay and High CEO Pay Ratios
A related trend of equally great concern is the excessive pay packages for CEOs, which are reflected in the extraordinarily high CEO pay ratios, particularly in the United States (Anderson et al. 2008; Hargreaves 2014; Holmberg and Schmitt 2014; Mishel and Davis 2014; Nocera 2014). The ratio of CEO salary (i.e., total compensation including bonuses and stock options) to that of an average employee has risen from the 25 to 40 range in the 1970s to more than 300 in recent years in the United States (see figure 1.6) (Mishel and Davis 2014).
These comparisons naturally raise the question: What is fair pay for a CEO relative to the pay of other employees?
A common response to this question is that the free market takes care of all this and determines the values of a CEO and the other employees. But is the market really efficient in determining CEO pay? As Robert Reich argues in his recent book Saving Capitalism (Reich 2015, xiv), “The meritocratic claim that people are paid what they are worth in the market is a tautology that begs the questions of how the market is organized and whether that organization is morally and economically defensible. In truth, income and wealth increasingly depend on who has the power to set the rules of the game.” This important point is also emphasized by Lucian Bebchuk and Jesse Fried in their book Pay without Performance: The Unfulfilled Promise of Executive Compensation (Bebchuk and Fried 2006). The widely held assumption of arm’s-length contracting in determining pay (i.e., contracting between executives attempting to get the best possible deal for themselves and boards trying to get the best deal for shareholders) is generally not upheld as much as one would like. As a result, managerial power has played a key role in sharply increasing executive pay.
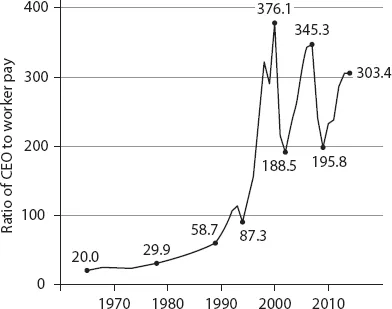
Figure 1.6 CEO pay ratio trend in the United States (Mishel and Davis 2014).
Bebchuk and Fried (2005, 8–9) observe:
The pervasive role of managerial power can explain much of the contemporary landscape of executive compensation, including practices and patterns that have long puzzled financial economists. We also show that managerial influence over the design of pay arrangements has produced considerable distortions in these arrangements, resulting in costs to investors and the economy. This influence has led to compensation schemes that weaken managers’ incentives to increase firm value and even create incentives to take actions that reduce long-term firm value.
They further elaborate:
Flawed compensation arrangements have not been limited to a small number of “bad apples”; they have been widespread, persistent, and systemic. Furthermore, the problems have not resulted from temporary mistakes or lapses of judgment that boards can be expected to correct on their own; rather they have stemmed from structural defects in the underlying governance structure that enable executives to exert considerable influence over their boards. The absence of effective arm’s length dealing under today’s system of corporate governance has been the primary source of problematic compensation arrangements. Finally, while recent reforms that seek to increase board independence will likely improve matters, they will not be sufficient to make boards adequately accountable; much more needs to be done.
Such a view is not held by academicians alone. The well-known compensation consultant Graef “Bud” Crystal (1991) wrote a highly critical commentary on the executive compensation practices in his book In Search of Excess. Things have worsened since then. Peter Drucker, the management guru, in his 2004 interview for Fortune was equally critical (Drucker and Schlender 2004):
In every boom there is a tendency toward hero-worship of CEOs. The smart CEOs methodically build a management team around them. But many of those celebrity CEOs who are so highly regarded don’t know what a team is. Moreover, the compensation inflation for CEOs has done very real damage to the concept of the management team. In an executive program I have at Claremont, the typical students are general managers of major divisions at very large companies, and they are very well paid. But it’s fair to say they are contemptuous of the excessive pay that many of their CEOs receive. J. P. Morgan once said the top manager of a company should have a salary 20 times that of the rank-and-file worker. Today it is more like 400 times that. I’m not talking about the bitter feelings of the people on the plant floor. They’re convinced that their bosses are crooks anyway. It’s the midlevel management that is incredibly disillusioned. And so the present crisis of the CEO is a serious disaster. Let me again quote J. P. Morgan, who said, “The CEO is just a hired hand.”
1.3 Economic Inequality: What Do People Consider Fair?
What, then, is fair compensation for CEOs? What do people think it should be? Do people even care about fairness?
Recently, business school professors Sorapop Kiatpongsan and Michael Norton (2014) asked 55,000 people in forty countries (including about 1600 people in the United States) these questions. A nice summary of their work can be found in Weissmann (2014), and we paraphrase it here. They asked participants how much they thought CEOs made compared with the average low-skill factory worker, and how much they should make. Table 1.1 shows the estimated, ideal, and actual ratios.
They found that there is remarkable consistency across countries and demographics. For example, Americans believed 6.7:1 would be ideal, while Australians said 8.3: 1; the French settled at 6.7:1 and the Germans around 6.3:1. Contrary to cultural stereotypes, Americans and Europeans hold similar notions of fairness. The Scandinavians arrived at a lower value around 2. But the entire range is about 2 to 8. The data also revealed that people dramatically underestimated actual pay inequality. In the United ...
Table of contents
- Cover
- Title Page
- Copyright
- Dedication
- Contents
- List of Tables
- List of Figures
- Preface
- 1. Extreme Inequality in Income and Wealth
- 2. Foundational Principles of a Fair Capitalist Society
- 3. Distributive Justice in a Hybrid Utopia
- 4. Statistical Thermodynamics and Equilibrium Distribution
- 5. Fairness in Income Distribution
- 6. Global Trends in Income Inequality: Theory Versus Reality
- 7. What Is Fair Pay for Executives?
- 8. Final Synthesis and Future Directions
- Notes
- Bibliography
- Index
Frequently asked questions
Yes, you can cancel anytime from the Subscription tab in your account settings on the Perlego website. Your subscription will stay active until the end of your current billing period. Learn how to cancel your subscription
No, books cannot be downloaded as external files, such as PDFs, for use outside of Perlego. However, you can download books within the Perlego app for offline reading on mobile or tablet. Learn how to download books offline
Perlego offers two plans: Essential and Complete
- Essential is ideal for learners and professionals who enjoy exploring a wide range of subjects. Access the Essential Library with 800,000+ trusted titles and best-sellers across business, personal growth, and the humanities. Includes unlimited reading time and Standard Read Aloud voice.
- Complete: Perfect for advanced learners and researchers needing full, unrestricted access. Unlock 1.5M+ books across hundreds of subjects, including academic and specialized titles. The Complete Plan also includes advanced features like Premium Read Aloud and Research Assistant.
We are an online textbook subscription service, where you can get access to an entire online library for less than the price of a single book per month. With over 1.5 million books across 990+ topics, we’ve got you covered! Learn about our mission
Look out for the read-aloud symbol on your next book to see if you can listen to it. The read-aloud tool reads text aloud for you, highlighting the text as it is being read. You can pause it, speed it up and slow it down. Learn more about Read Aloud
Yes! You can use the Perlego app on both iOS and Android devices to read anytime, anywhere — even offline. Perfect for commutes or when you’re on the go.
Please note we cannot support devices running on iOS 13 and Android 7 or earlier. Learn more about using the app
Please note we cannot support devices running on iOS 13 and Android 7 or earlier. Learn more about using the app
Yes, you can access How Much Inequality Is Fair? by Venkat Venkatasubramanian in PDF and/or ePUB format, as well as other popular books in Economics & Economic Theory. We have over 1.5 million books available in our catalogue for you to explore.