Kenneth A. Posner spent close to two decades as a Wall Street analyst, tracking the so-called "specialty finance" sector, which included controversial companies such as Countrywide, Fannie Mae, Freddie Mac, CIT, and MasterCard—many of which were caught in the subprime mortgage and capital markets crisis of 2007. While extreme volatility is nothing new in finance, the recent downturn caught many off guard, indicating that the traditional approach to decision making had let them down. Introducing a new framework for handling and evaluating extreme risk, Posner draws on years of experience to show how decision makers can best cope with the "Black Swans" of our time.
Posner's shrewd assessment combines the classic fundamental research approach of Benjamin Graham and David Dodd with more recent developments in cognitive science, computational theory, and quantitative finance. He outlines a probabilistic approach to decision making that involves forecasting across a range of scenarios, and he explains how to balance confidence, react accurately to fast-breaking information, overcome information overload, zero in on the critical issues, penetrate the information asymmetry shielding corporate executives, and integrate the power of human intuition with sophisticated analytics. Emphasizing the computational resources we already have at our disposal—our computers and our minds—Posner offers a new track to decision making for analysts, investors, traders, corporate executives, risk managers, regulators, policymakers, journalists, and anyone who faces a world of extreme volatility.

eBook - ePub
Stalking the Black Swan
Research and Decision Making in a World of Extreme Volatility
- English
- ePUB (mobile friendly)
- Available on iOS & Android
eBook - ePub
Stalking the Black Swan
Research and Decision Making in a World of Extreme Volatility
About this book
Trusted by 375,005 students
Access to over 1.5 million titles for a fair monthly price.
Study more efficiently using our study tools.
Information
Subtopic
Business GeneralIndex
BusinessPart I
Uncertainty
dp n="19" folio="" ?dp n="20" folio="" ? Chapter 1
Forecasting in Extreme Environments
Ideas, sentiments, emotions, and beliefs possess in crowds a contagious power as intense as that of microbes.
—Gustave Le Bon, The Crowd: A Study of the Popular Mind, 1896
attitude presupposes a certain amount of intellectual humility.
Perhaps only those can take it up who are aware they are some-
times wrong, and who do not habitually forget their mistakes.
It is born of the realization that we are not omniscient, and
that we owe most of our knowledge to others.
—Karl Popper, Conjectures and Refutations, 1963
—Humphrey Neill, The Art of Contrary Thinking, 1997
—Christopher Cherniak, Minimal Rationality, 1986
Black swans are but one manifestation of the uncertainty with which we peer into the future, mindful that other people are trying to do the same thing and that the interaction of opinions and decisions can affect the very future outcomes we are trying to foresee. Investors have strong incentives to make accurate forecasts in the face of this kind of uncertainty. So do decision makers in most any field characterized by competition, cooperation, or other forms of collective action.
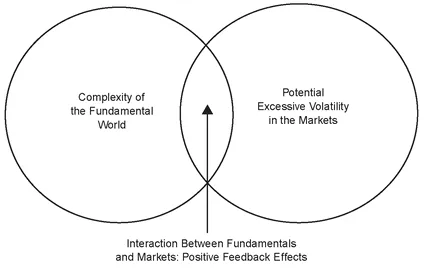
This chapter describes some of the main sources of extreme volatility and how to make better forecasts in challenging times. We consider three sources of volatility. First, volatility arises because the fundamental world is complicated and has nonlinear characteristics, which means that some events are about as predictable as the weather or earthquakes. Second, the nature of collective behavior can produce sudden shifts in consensus thinking, because people imitate each other in forming opinions. Third, markets do not simply reflect fundamental value; they also interact with the fundamental world, in some cases producing positive feedback effects that can lead to extreme outcomes. For these reasons, analysts face severe limits in forecasting fundamentals for even the simplest businesses, let alone industry developments or macroeconomic trends. That does not mean our swan-stalking quest is impossible. To surmount these challenges, it will help to take a close look at the scientific principles of forecasting.
Forecasting starts by identifying hypotheses and building models. Regardless of whether a model is intuitive, the outcome of conscious reasoning, or developed with a computer, forecasting relies upon a set of the principles that make up the scientific method. But outside the laboratory, it is easy to get sloppy, especially in fluid environments, where numerical data are not available for statistical tests. In my experience, real-world decision makers sometimes overlook two critical steps: calibrating models with the market and ensuring that hypotheses will be tested by upcoming information, what traders call “catalysts.” A simple rule of thumb is to agree with the consensus outlook unless you can point to a catalyst to test a different view. Of course, no rule is guaranteed to work all the time, but this one might help you avoid the disastrous losses that often accompany episodes of extreme volatility. Illustrating these points is a stock-picking story involving Fannie Mae during late 2007, just a few months before the government seized it and placed it into conservatorship.
Fannie Mae: The Gathering Storm
This story does not show how to “predict a Black Swan.” But it does demonstrate how the discipline of forecasting, with an emphasis on calibration and catalysts, can help avoid disaster. When operating during periods of extreme volatility, survival is the first priority.
During its waning days as a publicly owned institution, Fannie Mae presented me with a dilemma. Today we know that the U.S. Treasury placed Fannie Mae into conservatorship over fears that the company might suffer a fatal liquidity crisis. As of mid-2009, its stock traded under $1 per share. But in the early summer of 2007, this dismal fate was not yet apparent. The stock was trading in the $50s, and I was recommending it with an overweight rating. My investment hypothesis centered on what appeared to be lucrative returns in its business of guaranteeing mortgages against default, where the high fees it collected had more than compensated for the occasional loss on a bad loan. Such a profitable business was explained, I thought, by the duopolistic market position of Fannie and its sibling, Freddie Mac, as both firms enjoyed special benefits in their government charters, which essentially precluded competition. On the basis of my earnings forecast and valuation model, I thought Fannie’s stock was worth close to $70.
Why had investors lost sight of the value of this business? Perhaps because the company was not producing current financial statements, an obvious concern for any analyst who wanted to study the numbers. The lack of financials was the consequence of an accounting debacle in 2004 that had forced out management and required a multibillion-dollar restatement. My hypothesis about the value of the company’s guarantee business would soon be tested, because by year-end 2007 the company would resume current reporting status. This event would encourage analysts to focus on the stock, and I thought they would recognize the value of the guarantee business. So far, so good: I had a hypothesis and a catalyst. Of course, there were risks, too. Like everyone else, I expected the U.S. housing market to slow and Fannie’s credit losses to rise, but those were already factored into my earnings forecast and valuation (or so I thought).
As the summer progressed, clouds gathered on the horizon. Starting in July, liquidity in the market for mortgage securitizations began to dry up and the riskier bonds backed by subprime loans stopped trading. This was something of a surprise: I had anticipated widening spreads on these bonds, but I had not expected a halt in trading. Liquidity had not been an issue since the global currency crisis of 1998, when Russia’s default and the Long-Term Capital Management debacle temporarily threw the capital markets into disarray.
dp n="23" folio="6" ?But by August, problems in the capital markets had deepened; soon, even the highest-rated tranches of the subprime securitizations stopped trading. The nation’s largest mortgage originator, Countrywide, suffered a run on the bank. This was not a good sign.
Despite these omens, Fannie Mae’s stock held in the mid-$50s. After all, the company did not depend on securitization markets. Rather, it competed against them. Over the last few years, when booming home prices had catalyzed an explosion in subprime lending, the company had ceded almost half its market share to mortgage lenders that sold their increasingly risky loans into the securitization markets. Now with these markets in chaos, Fannie and Freddie were the only game in town. Their unique status as government-sponsored enterprises (GSEs) allowed them to raise debt at narrow spreads over U.S. Treasury rates, and in past crises, investors had flocked to the comparative safety of GSE debt, widening their cost advantage even further. There was no reason to think that capital-market volatility would imperil Fannie’s fundamentals. To the contrary, the company stood to raise prices and gain market share.
I drafted a report outlining the case for long-term revenue and earnings growth that would reiterate my overweight recommendation. The company had just raised its fees for guaranteeing mortgages against default, so the only question was how quickly new loans with high fees would cycle into the portfolio, replacing old loans and thus pushing up revenues. This took simple math, and I was confident in the projections. My report also included a new forecast of credit losses. I had analyzed Fannie’s experience in the California housing market downturn of the early 1990s, taking into account differences in products and market conditions between then and now. My analysis suggested that Fannie’s credit losses would rise but not necessarily become problematic.
My clients, however, showed little willingness to extrapolate credit losses from past cycles. “Analysts are underestimating Fannie’s losses,” one client warned me. She would not go into specifics and hung up before I could probe her reasoning. This reaction irritated me, because I had put a lot of thought into my analysis and wanted to debate the details. Truth be told, the client did not sound knowledgeable. (And how could she be? As a typical buy-side analyst, she was responsible for covering the entire financial services sector.) She seemed to be merely reacting to rumors and other people’s opinions.
dp n="24" folio="7" ?The deepening chaos in the capital markets indicated that a Black Swan might be beating its wings nearby. Today we know what the correct decision was going to be, but I did not have the advantage of hindsight in late 2007. How should I have decided what to do with Fannie Mae?
Sources of Extreme Volatility: Nonlinear Fundamentals
Before concluding this story, we need to delve deeper into volatility and how to analyze it. Economists and scientists have theorized extensively about volatility. A practitioner does not need to understand the math behind these theories, but appreciating the sources of extreme volatility helps one cope with it. I divide the sources of “extreme” volatility into three categories: the complexity of the fundamental world, the nature of collective behavior in the markets, and the potential for positive feedback between the two (Exhibit 1.1). Forecasting results for a company or industry typically involves simple, linear models. But as we all know, the fundamental world is more complicated, a fact appreciated by natural scientists, who grapple with butterfly effects, self-organized criticality, and other nonlinear processes.
EXHIBIT 1.1 Sources of Extreme Volatility
Butterfly Effects and Weather Forecasting
Weather forecasters have long been aware of nonlinearities in the atmosphere, a phenomenon often expressed by the term butterfly effect. Thanks to the movie Jurassic Park, many people are familiar with the idea, namely, that an event as insignificant as a butterfly flapping its wings over the Indian Ocean might lead—through a set of complex interactions—to a hurricane forming over the Atlantic. If similar effects influence the world of business and economic fundamentals, then it may often be impossible to forecast the long-term. The logical implication: start by focusing on the short-term.
To be sure, many people hold long-term investing in higher regard than short-term trading. But during periods of extreme volatility, this stance may be unrealistic. Weather forecasters have made progress in improving their short-term accuracy with better models and more granular data, and this should be the goal for analysts who are struggling with volatility in other sectors.
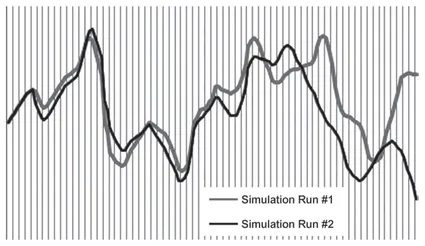
The term butterfly effect was coined by Massachusetts Institute of Technology (MIT) scientist Edward Lorenz in the early 1960s, when he was developing computer models to simulate the weather. Lorenz discovered something strange with his output when, for convenience, he tried to restart a simulation at the midpoint of its last run. To do so, he typed in the ocean surface temperature (the variable in question) from the last simulation run as the starting point from which the program was to resume its calculations. However, he discovered that after a few periods, the new simulation began to diverge from the old one, even though the same code was operating on the same input. Then it dawned on him that he had typed in the temperature to only 3 decimals, forgetting that the computer conducted calculations to 6 decimals. This tiny difference eventually accounted for a massive divergence in output (Exhibit 1.2). The technical term for this phenomenon is sensitive dependence on initial conditions.1
Fifty years after Lorenz coined the term, butterfly effects continue to vex weather forecasters. Studies of their work have found that accuracy degrades rapidly after the first twelve hours, and skeptics question whether there is any long-term predictive skill at work in the trade .2 However, the short-term accuracy of weather forecasting has improved in recent years.
dp n="26" folio="9" ?EXHIBIT 1.2 A Pair of Simulation Runs, Illustrating Sensitive Dependence on Initial Conditions
According to the American Meteorological Society (AMS), from 1987 to 2004 the nominal lead time for tornado warnings increased from less than 5 minutes to 13 minutes. In 2006, the average track error for hurricane forecasts made 48 hours in advance was as accurate as 24-hour forecasts a decade ago. The lead times for winter storm watches in 2006 averaged 17 hours, a 70% increase over 1999. The AMS data also show gains in monthly and tri-monthly forecasts.3 A study by scientists at the European Center for Medium-Range Weather Forecasts found a one-day gain in the predictability of atmospheric pressure in the Northern Hemisphere over the last decade: today’s 4- and 5-day forecasts are about as accurate as 3- and 4-day forecasts a decade ago. Similar gains in the Southern Hemisphere have been achieved in just the last 3 years.4
What has happened? New technology and better information are addressing the issues Lorenz found in his simulations. Higher-resolution data reduce the error inherent in the starting point for weather modeling, as if Lorenz had restarted his simulation with 4 or 5 decimals instead of 3. Satellite-borne instruments collect greater quantities of data about current conditions, including microwave radiance, humidity, and surface wind speed—especially important for the Southern Hemisphere, given limited data collection over the ocean from other sour...
Table of contents
- Title Page
- Acknowledgements
- Introduction
- Part I - Uncertainty
- Part II - Information
- Part III - Analysis and Judgment
- NOTES
- Copyright Page
Frequently asked questions
Yes, you can cancel anytime from the Subscription tab in your account settings on the Perlego website. Your subscription will stay active until the end of your current billing period. Learn how to cancel your subscription
No, books cannot be downloaded as external files, such as PDFs, for use outside of Perlego. However, you can download books within the Perlego app for offline reading on mobile or tablet. Learn how to download books offline
Perlego offers two plans: Essential and Complete
- Essential is ideal for learners and professionals who enjoy exploring a wide range of subjects. Access the Essential Library with 800,000+ trusted titles and best-sellers across business, personal growth, and the humanities. Includes unlimited reading time and Standard Read Aloud voice.
- Complete: Perfect for advanced learners and researchers needing full, unrestricted access. Unlock 1.5M+ books across hundreds of subjects, including academic and specialized titles. The Complete Plan also includes advanced features like Premium Read Aloud and Research Assistant.
We are an online textbook subscription service, where you can get access to an entire online library for less than the price of a single book per month. With over 1.5 million books across 990+ topics, we’ve got you covered! Learn about our mission
Look out for the read-aloud symbol on your next book to see if you can listen to it. The read-aloud tool reads text aloud for you, highlighting the text as it is being read. You can pause it, speed it up and slow it down. Learn more about Read Aloud
Yes! You can use the Perlego app on both iOS and Android devices to read anytime, anywhere — even offline. Perfect for commutes or when you’re on the go.
Please note we cannot support devices running on iOS 13 and Android 7 or earlier. Learn more about using the app
Please note we cannot support devices running on iOS 13 and Android 7 or earlier. Learn more about using the app
Yes, you can access Stalking the Black Swan by Kenneth A. Posner in PDF and/or ePUB format, as well as other popular books in Business & Business General. We have over 1.5 million books available in our catalogue for you to explore.