Gerontological Practice for the Twenty-first Century meets the need for state-of-the-art information on practice approaches with older patients that are age-specific and empirically based, blend "micro" and "macro" views, and reflect current themes in the aging and social work fields. The book is designed as a text for students and as a professional resource for practitioners. Clearly written, the book offers an expert and comprehensive review of the current literature and focuses on issues relating to the most vulnerable older people. Gerontological Practice for the Twenty-first Century also features case illustrations throughout and brief end-of-chapter questions for review.
The book has four parts. Part 1 reviews current and classic theories of aging and proposes an original framework for an integrative approach to practice with older people that incorporates both individual and policy-level interventions. The approach is based on current themes such as a life course perspective, heterogeneity, diversity, and inequality. Part 2 covers such common and important psychological problems among older individuals, as anxiety, depression, suicide, substance abuse, and dementia, and describes appropriate, evidence-based interventions. Part 3 considers the social psychological picture by discussing working with older families, end-of-life care, bereavement, and work and retirement. Part 4 focuses on core sociopolitical issues in the lives of older people: economic policy, poverty, health policy, quality-of-life concerns, and social services.
Current, authoritative, and original, this single-volume gerontology resource will be of valuable use to graduate students and practitioners.
eBook - ePub
Gerontological Practice for the Twenty-first Century
A Social Work Perspective
- English
- ePUB (mobile friendly)
- Available on iOS & Android
eBook - ePub
Gerontological Practice for the Twenty-first Century
A Social Work Perspective
About this book
Trusted by 375,005 students
Access to over 1.5 million titles for a fair monthly price.
Study more efficiently using our study tools.
Information
Subtopic
GerontologyIndex
Social SciencesPART 1
Overview and Theoretical Perspectives
CHAPTER 1
Social Work Practice in the Twenty-first Century
THE AGING OF THE UNITED STATES poses opportunities and challenges for social workers as the profession advances in this new millennium. The ethos of aging is changing as the population of older people becomes more ethnically diverse, lives and works longer, begins second and third careers, and struggles with chronic illnesses. The age considered to be “late life” has also changed. Middle age formerly began at 35, but today many view 45 and 67 as the beginnings of middle age and late life, respectively. In the new century midlife may commence around 50 and include the years between 50 and 69, with senescence not beginning until about 70.
How people will age in the future and how these changes will affect social work are important questions that we must answer. Other, related questions include what will become the most common problems of late life, and which elderly people will be most likely to encounter them? How will these transformations affect the psychology of aging? Will they alter how we age physically? Will age norms and roles change as demographics shift? How will communities respond to these transitions? Will society legislate social policies, laws, and regulations that adequately address elders’ needs? What practice techniques will work best with which older people? These are only a few of the questions that social workers must consider.
The next four chapters describe an integrated practice model for social workers who work with older people. The model incorporates contemporary theories from gerontology and social work and reflects the changing demographics and paradigm shifts in the United States and around the world. The theoretical concepts illuminate the promises and limitations of prevailing treatment strategies and the importance of approaching clients’ needs and concerns on multiple levels. Practitioners who understand the theoretical bases of the integrated practice model can be more effective in helping their older clients than those professionals who rely upon intuition and dated assumptions.
The complexity of the problems that older adults present to social workers requires a practice framework that incorporates micro and macro interventions as well as multidisciplinary practice. Well-developed therapies are more effective for older people when they are combined with social and environmental interventions. For example, a social worker may help a new widow cope with her feelings of loss and grief and recommend that she participate in a widow support group, thereby attending to the client’s psychological and social needs. People who lose loved ones benefit from a holistic approach that encourages them to grieve and to accept support from others. Other people who are facing loss remind us of the universality of grief and loss, and people who share their suffering with others who are grieving feel empowered and less alone. By encouraging social workers to recognize multiple factors in their assessments and interventions—how a person’s physical and mental well-being as well as his social needs and daily routines might be affected—, we will help older people from diverse backgrounds.
It is now axiomatic that not only do biological changes affect psychological functions but certain mental states affect physical status. Social events, such as caring for a sick relative or dealing with the loss of a spouse, can induce stress and other physiological changes. Stress lowers caregivers’ immune system and increases their susceptibility to illness. Instead of working with clients’ discrete problems, gerontological social workers must intervene on affective, cognitive, behavioral, and environmental levels simultaneously. Most gerontologists, regardless of discipline, agree that holistic treatment approaches help elderly people more than do strategies that treat cognitive, affective, or social functioning in a vacuum. The first chapter highlights demographic changes during the twentieth century that have important implications for gerontological practice.
DEMOGRAPHICS OF AGING
The number of Americans aged 65 and older increased tenfold during the twentieth century, from 3.1 million in 1900, when the median age was 22.9 and older people represented only 4% of the population, to 35 million in 2000, when the median age was 35.3 and older people comprised 12.4% of the United States population (see figure 1.1). The substantial increases also occurred in the group of people aged 85 and older (see figure 1.2). This group grew from 122,000 individuals in 1900 to 4.2 million in 2000. This graying of the population will continue as fertility rates decline and life expectancies, which are now at an all-time high at 77.2 years, continue to rise (National Center for Health Statistics [NCHS], 2003a).
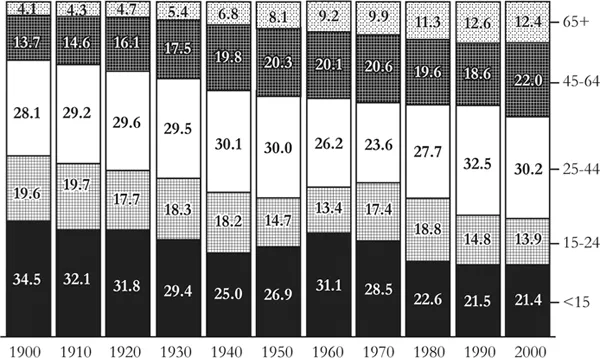
FIGURE 1.1 Distribution of the Total U.S. Population by Age: Percentages, 1900–2000
Source: Hobbs and Stoops, 2000, figure 2-4, p. 56.
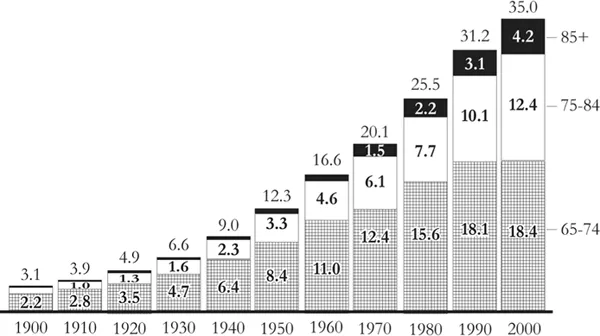
FIGURE 1.2 U.S. Population Aged Sixty-five and Older, 1900–2000 (Millions)
Source: Hobbs and Stoops, 2000, figure 2-6, p. 59.
Older women still vastly outnumber older men, especially in the oldest age groups (see figure 1.3). In 2002 the United States was home to 14.2 million men and 19.5 million women older than 65 and about 1 million men and 2.4 million women older than 85 (Spraggins, 2003). Gender differences in life expectancy (74.4 for males and 79.8 for females born in 2001) are expected to continue for at least the next fifty years.
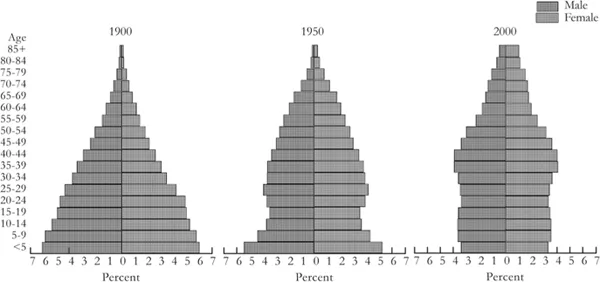
FIGURE 1.3 Age and Sex Distribution of the Total U.S. Population: 1900, 1950, and 2000
Source: Hobbs and Stoops, 2000, figure 2-1, p. 53.
Although most men older than 65 are married (approximately 75%), most women in this age category are single (almost 60%). Older women are four times more likely to be widowed than their male counterparts; there were 8.9 million widowed women (46%) compared to 2 million widowed men in 2002 (nearly 14%) (U.S. Census Bureau, 2003c) (see figure 1.4). Another 10% of older women were either divorced or separated, and about 4% never married. According to the Policy Institute of the National Gay and Lesbian Task Force, one to three million (3–8%) Americans older than 65 are gay, lesbian, bisexual, or transgender (Cahill, South, and Spade, 2000). Although we have minimal data from national samples, most experts estimate that the U.S. population in the twenty-first century will have a greater proportion of older lesbians than older gay men, especially among the oldest old (Barker, 2004).
Every census since 1970 has found more people living alone than the previous census recorded, and older women—73 to 77% of all female heads of household older than sixty-five during this period—were especially likely to live in one-person households (see figure 1.5).
The proportion of older men living alone remained substantially smaller than the proportion of older women who lived in single-person dwellings between 1960 and 2000. At the same time the percentage of male heads of household aged 65 and older who were living alone increased in every decade (see figure 1.5). The most common one-person households included older white adults; older blacks, Hispanics, and Asian and Pacific Islanders are less likely to live alone (U.S. Census Bureau, 2000).
The number of people who are members of ethnic minorities in the United States has increased dramatically since the mid-1970s. Figures 1.6 and 1.7 show the changes in the minority elderly population over time. Although minorities represent larger percentages of younger age groups, the minority population in every age group was larger in 1990 and 2000 than in 1980 (Hobbs and Stoops, 2002).
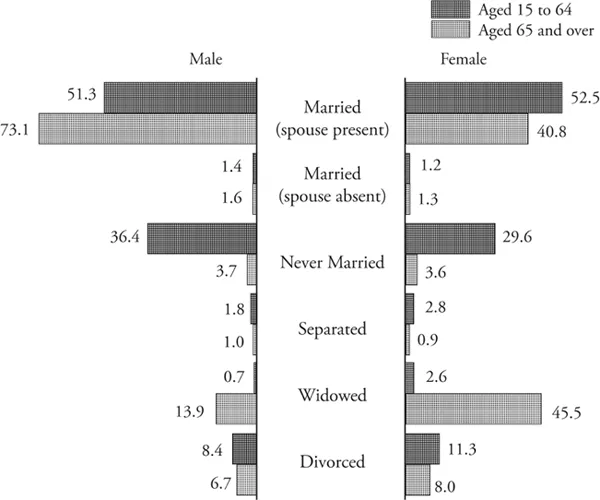
FIGURE 1.4 Marital Status by Sex and Age, 2002 (Percentages of Population Aged Fifteen and Older)
Source: Spraggins, 2003, figure 3, p. 2.
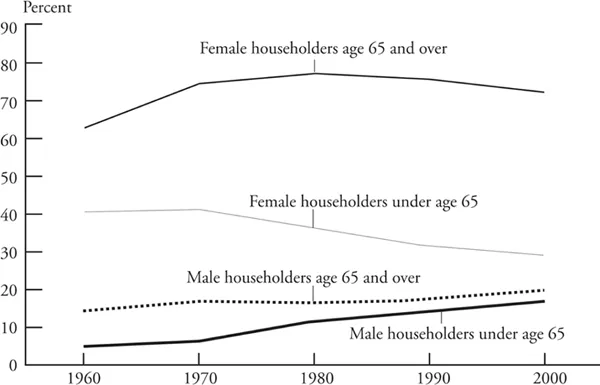
FIGURE 1.5 One-Person Households Within Age-Sex Groups: Percentages, 1960–2000
Source: Hobbs and Stoops, 2000, figure 5-7, p. 157.
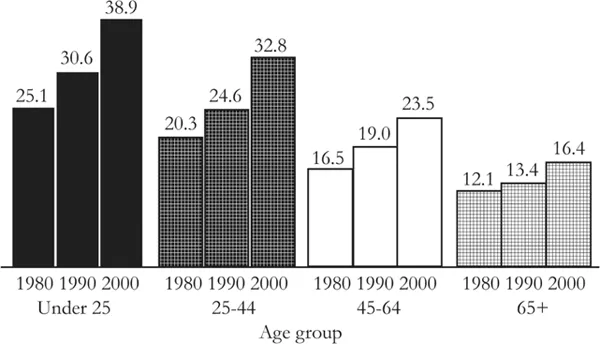
FIGURE 1.6 Percent Minority by Broad Age Group: 1980 to 2000
Source: Hobbs and Stoops, 2000, figure 3-21, p. 107.
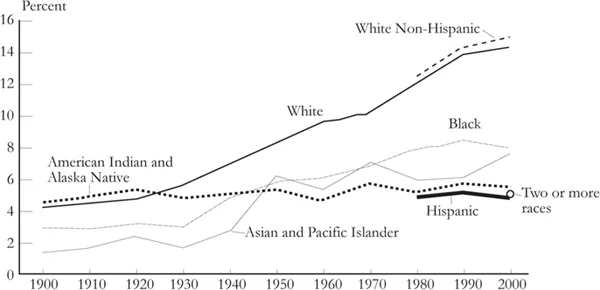
FIGURE 1.7 U.S. Population Aged Sixty-five and Older by Race and Hispanic Origin: Percentages, 1900 to 2000
Note: Complete data on Hispanic origin have been available only since 1980, and data on the population of two or more races are available only from the 2000 census.
Source: Hobbs and Stoops, 2000, figure 3-23, p. 109.
The older black population has grown steadily over time (see figure 1.7). In 1980 the U.S. population included 2.1 million blacks aged 65 and older, in contrast to 2.5 million in 1990 and 2.8 million in 2000, when older black men and older black women represented, respectively, 6.7% and 9% of the black population (figure 1.8).
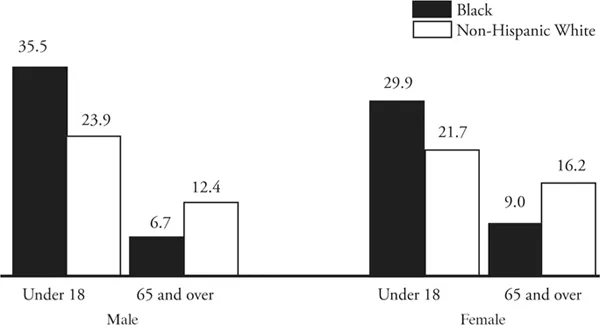
FIGURE 1.8 Population by Age, Sex, and Race, 2002 (Percentage of Population)
Source: McKinnon, 2003, figure 3, p. 2.
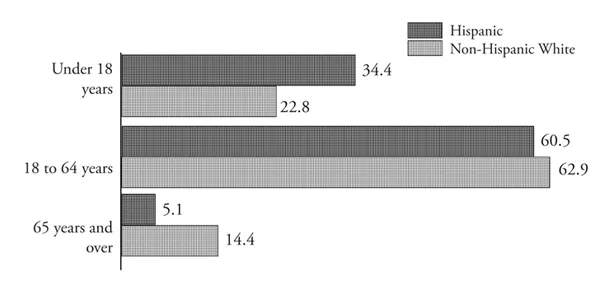
FIGURE 1.9 U.S. Population by Hispanic Origin and Age Group: Percentages of Each Population, 2002
Source: Ramirez and de la Cruz, 2003, figure 3, p. 2.
Significant differences exist in the average life expectancies of blacks and whites. The average life expectancy for black males born in 2001 was 68.6, in contrast to 75 for white males. The average life expectancy for black females was 75.5, in contrast to 80.2 for white females (NCHS, 2003a).
The older Hispanic population has also increased. It rose from 0.7 million in 1980 to 1.1 million in 1990 to 2 million in 2002, when older Hispanics represented about 5.1% of the total Hispanic population (Administration on Aging [AOA], 2003b) (see figure 1.9). The number of these elderly people will continue to increase. Older Hispanics, who will soon become the largest minority group in the cohort of people aged 65 and older, are expected to account for 16% (13.4 million) of that group by 2050 (AOA, 2003b) (see figure 1.10).
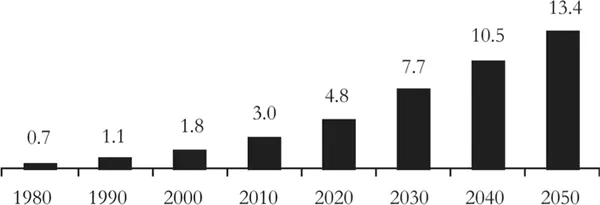
FIGURE 1.10 Population of Hispanic Origin Aged Sixty-five and Older: 1980–2050 (Millions)
Source: Administration on Aging, 2003b, p. 1.
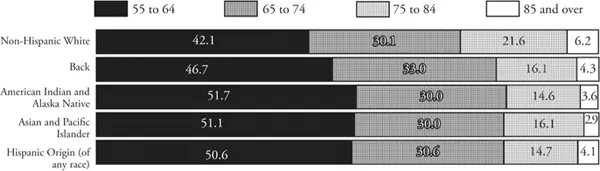
FIGURE 1.11 Percentage Distributions of People Aged Fifty-five and Older by Race, Hispanic Origin, and Age, 2002
Source: D. Smith, 2003, figure 2, p. 2.
Although the numbers of Asian and Pacific Islanders in this country have also risen since 1980, the percentage increase of those older than sixty-five has remained stable since 1980 at about 7% (Reeves and Bennett, 2003). Figure 1.11 illustrates the distribution of people aged fifty-five and older by race, Hispanic origin, and age.
Although poverty rates among older people have declined since 1990 (from 12.2% in 1990 to 10.4% in 2002), many older people remain poor (see figure 1.12). About 17% of people older than 65 and nearly 20% of people older than 75 were within 125% of the poverty level in 2002 (Proctor and Dalaker, 2003). The highest poverty rates continue among older blacks: 38.5% of black women were poor or near poor, compared to 18.6% of older white women and 10.8% of older white men in 2002. Among black women older than 75, almost half (41.5%) were poor or near poor (see figure 1.12). Hispanic men and women older than 65 also have high rates of poverty: 31.1% and 33.9%, respectively, were within 125% of the poverty level in 2002. The 31.6% of Hispanic men and 35.4% of Hispanic women older than 75 also were within 125% of the poverty level. Unlike other ethnic groups, Hispanics have seen poverty rates decline for those older than 65, but poverty rates have remained steady among all Hispanics. The Hispanic and black elderly continue to have higher rates of poverty than older white, non-Hispanic people and older Asian and Pacific Islanders, who have the lowest poverty rates (9.9%) of any ethnic group (Proctor and Dalaker, 2003).
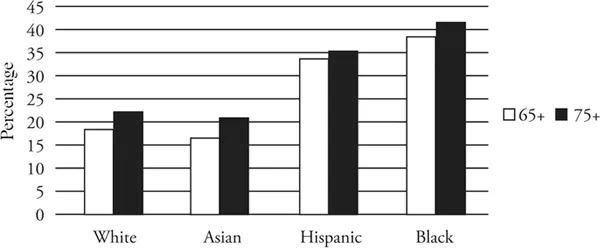
FIGURE 1.12 Poverty Among Older Women by Age and Ethnicity, 2002
Source: U.S. Census Bureau, 2003a, table 17.
Many older adults will remain productive and live in good health, free of substantial limitations on their activity. For people aged sixty-five, about 87% of white men, 83% of black men, 80% of white women, and slightly more than 72% of black women can expect to be able to remain independent (NCHS, 2003b). At the same time many older people, especially those in the oldest age categories, suffer from chronic illnesses, commonly heart diseases, hypertension, and diabetes. Chronic illnesses are especially prevalent among older women and older members of minority groups (NCHS, 2003a). While only 44.8% of sixty-five-year-old women can expect to live free of chronic arthritis for less than half of their remaining years, 58.1% of men of that age can expect to live without arthritis for the rest of their lives. Fifteen percent of women aged sixty-five and older are also more likely to require help with living independently than are men in the same age group (9%). Twenty-two percent of older non-Hispanic black women require more assistance in living independently than do older non-Hispanic white women (14%) or older Hispanic women (17%) (NCHS, 2003b). At each age and within each race, more men than women can expect to live a larger share of their lives free of any limitation (NCHS, 2003b). The difference between the white and black populations in the number of years that they are expected to live free of limitations is statistically significant (p < 0.05) at all ages, except for men aged eighty and older and for women aged eighty-five and older.
CONTEMPORARY AGING THEMES AND IMPLICATIONS FOR GERONTOLOGICAL SOCIAL WORK
These demographic changes have important implications for social workers generally and for gerontological social workers in particular. The data indicate the need for a practice model of aging that incorporates a multidisciplinary life course perspective and recognizes the importance of heterogeneity, diversity, and inequality. An integrative practice approach is especially important with older clients, who typically present complex issues involving interactive biological, psychological, and social factors. Although older adults today are healthier than any previous cohort of elderly people, many will need help managing chronic illness, coping with loss, and meeting financial exigencies. The integrative practice approach that we present in the chapters that follow reflect these changing demographics and embraces recent concepts that have emerged in gerontology and social work. Germain and Gitterman (1996) also incorporate these concepts in their model of social work practice (see also Germain and Bloom, 1999).
The Life Course Perspective
A life course approach assumes that the past and present are inextricably linked and that understanding one stage of life is necessary in order to understand the others. The approach views late life within the context of a person’s previous choices and experiences. A central tenet of the life course perspective is to investigate and strengthen interactions between the individual and the environment, between the personal and the political, and between the micro (or clinical) and the macro (or policy) levels.
The life course perspective views the person within the context of historical, social, and individual time. Developmental and biological changes influence life experiences within the context of social and historical events as people age with others born at the same time, in other words, their age cohort. Even when they share similar historical and social experiences, however, older people will interpret events according to their subjective perceptions; personal characteristics, such as gender and ethnic background; and psychological orientations, including how they cope, feel, and react to life changes. Social time is based on age norms and expectations about how and when people should experience major life transitions. In late life the most common life transitions are widowhood and retirement. Historical events or social periods affect all people and age cohorts simultaneously. Examples of historical events that affected most older people include the depression and World War II.
Historical, social, and personal time affect all adults as they age and account for certain characteristics, including attitudes or beliefs, that simultaneously affect all members of a cohort. These three dimensions also explain the diversity of views and lifestyles among older adults and t...
Table of contents
- Cover
- Half title
- Series Page
- Title
- Copyright
- Dedication
- Contents
- Preface
- Acknowledgments
- Part 1. Overview and Theoretical Perspectives
- Part 2. Psychological Problems and Interventions
- Part 3. Social Psychological Problems and Interventions
- Part 4. Sociopolitical Issues
- References
- Subject Index
- Name Index
Frequently asked questions
Yes, you can cancel anytime from the Subscription tab in your account settings on the Perlego website. Your subscription will stay active until the end of your current billing period. Learn how to cancel your subscription
No, books cannot be downloaded as external files, such as PDFs, for use outside of Perlego. However, you can download books within the Perlego app for offline reading on mobile or tablet. Learn how to download books offline
Perlego offers two plans: Essential and Complete
- Essential is ideal for learners and professionals who enjoy exploring a wide range of subjects. Access the Essential Library with 800,000+ trusted titles and best-sellers across business, personal growth, and the humanities. Includes unlimited reading time and Standard Read Aloud voice.
- Complete: Perfect for advanced learners and researchers needing full, unrestricted access. Unlock 1.5M+ books across hundreds of subjects, including academic and specialized titles. The Complete Plan also includes advanced features like Premium Read Aloud and Research Assistant.
We are an online textbook subscription service, where you can get access to an entire online library for less than the price of a single book per month. With over 1.5 million books across 990+ topics, we’ve got you covered! Learn about our mission
Look out for the read-aloud symbol on your next book to see if you can listen to it. The read-aloud tool reads text aloud for you, highlighting the text as it is being read. You can pause it, speed it up and slow it down. Learn more about Read Aloud
Yes! You can use the Perlego app on both iOS and Android devices to read anytime, anywhere — even offline. Perfect for commutes or when you’re on the go.
Please note we cannot support devices running on iOS 13 and Android 7 or earlier. Learn more about using the app
Please note we cannot support devices running on iOS 13 and Android 7 or earlier. Learn more about using the app
Yes, you can access Gerontological Practice for the Twenty-first Century by Virginia E. Richardson,Amanda S. Barusch in PDF and/or ePUB format, as well as other popular books in Social Sciences & Gerontology. We have over 1.5 million books available in our catalogue for you to explore.