![]()
PART 1
Classical Technical Analysis
![]()
Chapter 1
Introduction to Technical Analysis
1.1 What Is Technical Analysis?
Technical analysis (TA) is a broad area of study. Technical analysis is the tracking and prediction of asset price movements using charts and graphs in combination with various mathematical and statistical methods. More precisely, it is the quantitative criteria for predicting the relative strength of buying and selling forces within the market to determine what to buy, what to sell, and when to execute trades. Technical analysis should be distinguished from fundamental analysis, its counterpart in the world of price forecasting and market action, which involves the evaluation of elements that measure, reflect, or influence the supply of and the demand for a firm’s goods or services. While technical analysis was once considered as nothing more than the art of “chart-reading”, it is now an accepted field of study in the analysis of the stock market. A great number of mathematical and statistical indicators are increasingly being introduced and integrated with prevailing practices, thus building technical analysis into a scientific and sophisticated system of tools and techniques to monitor and estimate trends in the stock market, both macro and micro.
Price is of the utmost importance in applying technical analysis to the stock market. Traders and investors use market filters or indicators to capture a watchlist of shares (see Figure 1.1). The diligent technical analyst will concentrate primarily on the price movement on an asset. Such an approach is based on the premise that market action discounts everything; whatever factor can possibly affect the market price of a stock, be it fundamental, political, psychological, or others, is already reflected in the price of that stock. The trading volume, if need be, is used as a secondary check in the analysis. The technical analyst will then identify any price trends with the aid of a chart, an essential tool in technical analysis.
Figure 1.1: Stock screener on online discount brokerage Scottrade
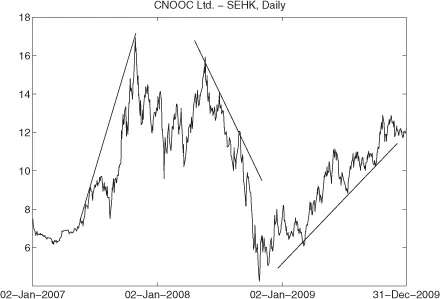
A trend is a price movement in motion that continues in the same direction until it reverses in an opposite direction due to changes in force. Since the price movements of a stock over a reasonable period of time are plotted in the form of a chart, certain patterns will be formed from the past performance of the stock prices, and trends are easily spotted. If such a chart pattern shows a trend line, straight lines drawn through the troughs or the pinnacles of an asset price line within a specific period (see Figure 1.2), it is considered a clear trend, which the technical analyst will take into account in his analysis before predicting the timing of a reversal pattern. Although spotting a reversal trend is a challenging part in technical analysis, the breaking of an important trend line is usually the first sign of reversal. With these signals, the technical analyst decides on when and whether to buy or sell a stock.
1.2 Origin of Technical Analysis and Its Development
The application of technical analysis as a trading method could be traced back to the trading of Japanese rice on the Dojima Rice Exchange in Osaka as early as late 1600s. One approach, known as “Japanese candlesticks” (a chart showing “candles” formed by the opening, closing, high and low prices of a commodity), was documented by a certain Munehisa Homma, born in 1724. However, this trading method was not widely adapted until technical analysis became popularized in the late 1980s. In the West, technical analysis started in the early 1900s with point and figure charting and the Dow theory [Schannep (2008)], then evolved into chartism in the early twentieth century. One main criticism that slows its mainstream acceptance is that chartism is inherently subjective. To counter this, technical analysis later developed into precise mechanical trading rules as well as complicated trading systems with multiple data input. Since mathematical formulas are used to generate signals under these sophisticated trading rules and systems, subjectivity is eliminated from the interpretation of the signals. This development is aided by the introduction of computers which take the tedium out of complex mathematical manipulations.
Figure 1.2: Clear trend lines on typical stock price movement
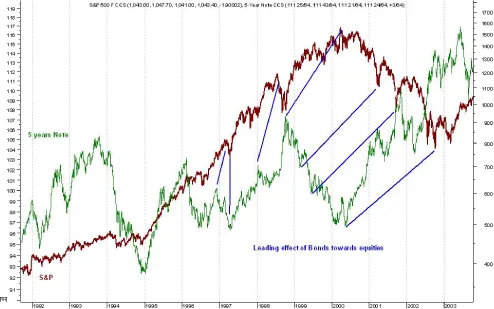
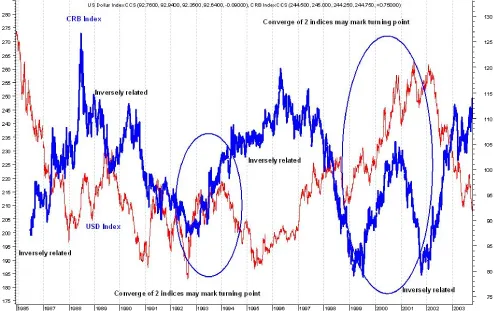
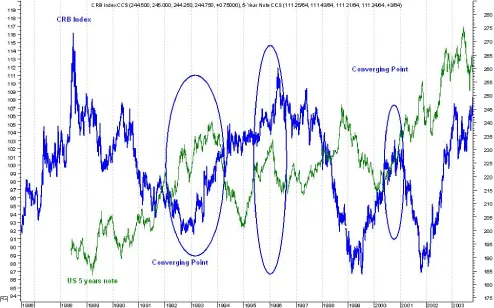
Nowadays, technical analysis covers the more exotic methods, like the use of astronomical cycle, 28-day trading cycle (the Lunar cycle), 10.5-month futures cycle, January effect, 4-year cycle (the Kitchin cycle [Kitchin (1923)] and the presidential election cycle [Wong and McAleer (2009)]), 9.2-year cycle (the Juglar cycle), 54-year cycle (the Kondratieff cycle [Kondratiev (1925)]), Elliott wave [Elliott (1938); Frost and Prechter (2005)], as well as Gann’s trading methods [Gann (1935); Reddy (2012)]. Meanwhile, high-capacity computers initiate a family of modern-day indicators that combine traditional price and volume data with other factors such as economic data. The relationship between commodities, US dollar, world currencies, bonds, interest rates and equities are often explored to develop innovative indicators. A typical trading signal could simply be the combination of gross domestic product (GDP) growth rate, interest rate and price-to-earnings (P/E) ratios, with asset price and volume data. One classic example is that movements in bond prices are often a good estimator of movement in equity indices: the prices of 5-year Treasury notes are shown to have successfully predicted the S&P 500 with considerable foresight, known as the “leading effect” (see Figure 1.3). In another example, since a clear inverse relationship exists between the US dollar and the Commodity Research Bureau (CRB) Index, and because the relationship between the prices of 5-year Treasury notes and the CRB Index is positive (see Figures 1.4 and 1.5, respectively), the CRB Index becomes a reliable technical indicator of the price movement of assets correlated with it. Additionally, other methods such as artificial neural network, genetic algorithms, chaos theory, and fuzzy logic are actively employed to meet the needs from the financial industries. These are convincing proofs that technical analysis has been constantly evolving and is no longer confined to simply chart pattern reading.
Figure 1.3: The “leading effect” of 5-year Treasury notes over the S&P 500
Figure 1.4: Inverse relationship between the US dollar and the CRB Index
Figure 1.5: Positive relationship between the 5-year Treasury notes and the CRB Index
1.3 Application of Technical Analysis in Stock Markets
The application of technical tools for market timing decisions has been the subject of much discussion. Some academics have questioned the usefulness of technical analysis, arguing that traders using technical analysis indicators usually cannot produce better returns than those who apply the buy-and-hold strategy using fundamental indicators. For example, studies done on the rules that dictate buy and sell signals, known as filter rules, conclude that traders on the New York Stock Exchange (NYSE) do not generate significantly superior returns using filter rules compared to investors using a buy-and-hold strategy. In particular, returns could turn out to be negative if transaction cost is considered [Fama and Blume (1966); Jensen and Bennington (1970); Ball (1978)]. Furthermore, it has been suggested that an accuracy of 70% or more is required for any market timing strategy to produce returns in excess of the buy-and-hold strategy [Sharpe (1975)]. These studies, however, judge the value of market timing strategies solely by comparing its returns with the buy-and-hold strategy returns [Samuelson (1989)].
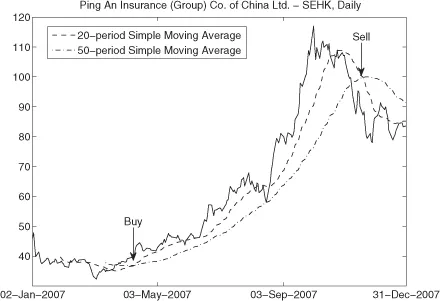
Practitioners, on the other hand, have frequently claimed that they can achieve superior performance with sound market timing skills. By using a proper system of indicators, either technical or economic, traders claim to be able to generate enormous returns. In fact, it is noted in Allen and Taylor (1989) that “some chartists’ forecasts were remarkably good and could not be improved upon by a range of alternative forecasting procedures”. Indeed, in some financial markets, traders have been known to generate large profits consistently over a relatively long period of time (Figure 1.6 shows the successful application of technical analysis signals in trading). Thus the argument puts forth, that non-fundamentalist traders would be quickly driven out of business by fundamental buy-and-hold investors, continues to remain under close scrutiny [Friedman (1953); Fama (1970)].
Various reports reveal that practitioners do turn to technical analysis. From Allen and Taylor (1989, 1992), about 90% of chief dealers make use of technical indicators to estimate the expected future price movements. Another 60% of them feel that technical analysis is at least as important as fundamentals. Technical analysis comes right after fundamental analysis among investment managers, while portfolio analysis is the lowest rated [Carter and Van Auken (1990)].
Including technical analysis in financial market forecasting is not unusual among professional investors. A survey by Euromoney reveals that in the 80s, there exists a transition from fundamental analysis to technical analysis [Frankel and Froot (1990a)]. Lui and Mole (1998) find that “more than 85% of respondents rely on both fundamental and technical analysis for predicting future rate movements at different time horizons”. Technical analysis is “considered slightly more useful in forecasting trends than fundamental analysis, but significantly more useful in predicting turning points”. Traders in Hong Kong, Japan and Singapore also rely on technical analysis heavily in foreign exchange markets [Cheung and Wong (1999)].
Figure 1.6: Buy and sell signals on the China Ping an Insurance
On the other hand, detailed and updated technical analysis information can be obtained conveniently from real-time financial data providers like Reuters and Bloomberg. This is another indication that technical analysis is highly demanded, which also results in competition among financial information services to offer the latest technical analysis tools.
1.4 Basic Principle of Technical Analysis
The basic principle of technical analysis is to identify and go along with the trend. This assumes that there is an uneven distribution of information — that “smart money” acts on information before it becomes public. Thus, asset prices would reflect the information available to “smart money”. This is consistent with the idea of costly information, where competitive incentives for traders to seek information results in an equilibrium where information is passed along through prices [Grossman and Stiglitz (1976); Grossman (1976)].
We can conclude that because of its popularity among the ordinary as well as professional investors, the information extracted by technical analysis w...