There has been great progress and increase in demand for medical imaging. The aim of this book is to capture all major developments in all aspects of medical imaging. As such, this book consists of three major parts: medical physics which includes 3D reconstructions, image processing and segmentation in medical imaging, and medical imaging instruments and systems. As the field is very broad and growing exponentially, this book will cover major activities with chapters prepared by leaders in the field.This book takes a balanced approach in providing coverage of all major work done in the field, and thus provides readers a clear view of the frontier activities in the field. Other books may only focus on instrumentation, physics or computer algorithms. In contrast, this book contains all components so that the readers will obtain a full picture of the field. At the same time, readers can gain some deep insights into certain special topics such as 3D reconstruction and image enhancement software systems involving MRI, ultrasound, X-ray and other medical imaging modalities.
- 512 pages
- English
- ePUB (mobile friendly)
- Available on iOS & Android
eBook - ePub
Frontiers Of Medical Imaging
About this book
Trusted by 375,005 students
Access to over 1.5 million titles for a fair monthly price.
Study more efficiently using our study tools.
Information
Subtopic
Science GeneralIndex
Biological SciencesPart 1
Theory, Techniques and Physics
Chapter 1
Coronary Plaque Quantification by
Multi-slice Computed Tomography
Multi-slice Computed Tomography
Coronary artery disease (CAD) is one of the main causes of human deaths in the western world. Usually, patients are being diagnosed by ECG analysis first, after which for asymptomatic patients additional tests are necessary. Ultimately an imaging procedure might be necessary to image the coronary arteries. Until a decade ago invasive coronary angiography was the standard imaging method for this. Since then, minimal invasive coronary angiography by multi-slice computed tomography (MSCT-CA) became available and has been a highly investigated imaging technique and may become a standard imaging tool for the diagnosis of coronary artery disease (CAD). The three-dimensional (3D) nature of MSCT-CA allows 3D image reconstruction from which quantitative parameters of the coronary arteries and plaques can be derived.
1. Introduction
Multi-slice computed tomography of coronary arteries (MSCT-CA) has gained large interest as a diagnostic imaging tool for patients suspected of coronary artery disease (CAD).1–3 The three-dimensional (3D) nature of MSCT-CA allows 3D image reconstruction of the coronary artery tree4 with the advantage over standard coronary angiography to show not only luminal obstructions but also plaque formation.5 Quantitative MSCT-CA (QMSCT-CA) has been developed6–9 and most manufacturers are currently implementing computer-assisted analysis tools in their MSCT-CA analysis consoles.
Since plaque composition is one of the important predictors of future events, quantification of its composition by a non-invasive imaging method would have advantages.10,11 Early attempts by MSCT showed mixed results.5,12 This could be explained by the lack of a robust dedicated MSCT-CA plaque compositional analysis method.5,13–15 There are also technical difficulties comparing in-vivo MSCT-CA data to reference methods, such as intravascular ultrasound (IVUS) or histology. Despite the rapid technical developments of MSCT-CA, the thickness of reconstructed cross-sectional images is currently 400 to 600 micron and is significantly below that of IVUS (approximately 200 micron) and histology (6 micron). Since plaque components are mostly heterogeneously distributed, straightforward comparison of a single individual cross-sectional MSCT-CA image against a single individual cross-section of one of these two reference methods (e.g. a straightforward 2D comparison) may also lead to divergent results.
This book chapter describes a possible computer-assisted volumetric method for quantitative plaque compositional measurements by MSCT-CA which was tested on ex-vivo human coronary specimen data.
2. MSCT Procedure
The developments in coronary MSCT imaging are advancing fast. Until a few years ago 4 and 16-slice scanners were the standard, today 320 slice scanners capable of acquiring multi-phases of the heart cycle are available. However, concerning the detection of coronary plaques and the evaluation of their composition, nothing much has changed as the image resolution, e.g. the voxel resolution did not change. So, those principles are overall still similar compared to the previous generations of MSCT scanners.
Patients who underwent MSCT scanning were in sinus rhythm with a heart rate <70 beats/min (spontaneously or after oral β-blockade). A bolus of 120 ml of iodinated contrast medium (Visipaque 320, Amersham Health, Little Chalfont, United Kingdom) was administered through an arm vein (4ml⁄s). Scan parameters were a detector collimation of 16 × 0.75 mm, a table feed of 3.0 mm/rotation, a gantry rotation time of 0.42 second, and a tube voltage of 120 kV. Datasets of reconstructed coronary vessels were created at different points of the cardiac phase, e.g. 350-, 400- and 450 ms before the next R-wave, using a retrospectively ECG-gated reconstruction algorithm (Siemens, Forchheim, Germany). This algorithm uses data of a single heartbeat obtained in half gantry rotation time resulting in a temporal resolution of 188 ms. Datasets reconstructed within the middle- and later phase of diastole provided nearly motion-free image quality. All MSCT datasets were uploaded to an MSCT-Picture Archiving and Communication System (CT-PACS).
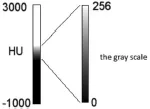
Fig. 1. The CT Hounsfield scale, air is assigned a value of –1000, and bone +3000. The grayscale color corresponding HU values, depending on the window setting selected.
3. Coronary Plaque Segmentation
3.1. MSCT-CA Image Processing
MSCT identifies different human tissues by their various ability to absorb X-ray. Attenuation variability measured in Hounsfield Units (HU) is given by:

Where µwater and µtissue are the linear attenuation coefficients of water and tissue of interest. Next Hounsfield scale is converted to values of greyscale (Fig. 1). Changes of these regions are larger than 256 values, which makes it impossible to visualize all values of grayscale simultaneously on a computer display. Images are generated by the defined window of HU values.
Parameters of window are described using the terms center (L) and a width (W). In this way, referring to the brightness (center) and to contrast (width) of the image. Frame image sets range: from L – 1/2W to L + 1/2W.
All pixels of the image smaller than L – 1/2 or larger L + 1/2 are either white or black.
The figure below (Fig. 2) shows the same image, but displayed with different parameters for L and W. There is a noticeable change in image brightness and contrast.
Dense tissue attenuates X-rays much more compared to softer tissues and is displayed as bright structures identifying the so-called high HU values.
Standard coronary plaque compositional measurements by MSCT-CA is often performed by retrieving absolute HU values at a limited number of positions within a coronary plaque at a typical individual cross-sectional location, mostly with the largest visible amount of plaque, within the coronary vessel. This makes it difficult to derive a comprehensive overview of the coronary plaque in the complete affected region of interest. The proposed method in this chapter derives the total plaque composition from the HU distribution in an arbitrary coronary plaque segment.
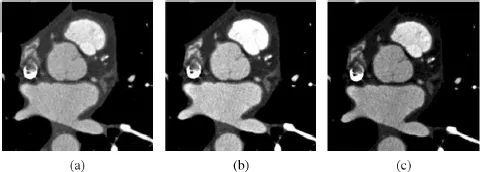
Fig. 2. These three images are of the same section, viewed at different windows settings. (a) a window center of 140 and a window width of 900, (b) a window center is 140 and a window width 700 and (c) a window center 240 and a window width 700 Hounsfield units. This enables details of plaque in coronary vessel.
After the MSCT scan the image data were stored in the DICOM format onto a DVD, today it is stored onto a picture archiving and communication system (PACS). From the MSCT-CA scanned volume, the coronary arteries can be semi-automatically extracted by dedicated vessel extraction software (MSCT Extractor,...
Table of contents
- Cover
- Half title
- Title
- Copy right
- Preface
- contents
- Part 1: Theory, Techniques and Physics
- Part 2: Image Processing in Medical Imaging
- Part 3: Emerging Methods and Medical Imaging Systems
- Index
Frequently asked questions
Yes, you can cancel anytime from the Subscription tab in your account settings on the Perlego website. Your subscription will stay active until the end of your current billing period. Learn how to cancel your subscription
No, books cannot be downloaded as external files, such as PDFs, for use outside of Perlego. However, you can download books within the Perlego app for offline reading on mobile or tablet. Learn how to download books offline
Perlego offers two plans: Essential and Complete
- Essential is ideal for learners and professionals who enjoy exploring a wide range of subjects. Access the Essential Library with 800,000+ trusted titles and best-sellers across business, personal growth, and the humanities. Includes unlimited reading time and Standard Read Aloud voice.
- Complete: Perfect for advanced learners and researchers needing full, unrestricted access. Unlock 1.5M+ books across hundreds of subjects, including academic and specialized titles. The Complete Plan also includes advanced features like Premium Read Aloud and Research Assistant.
We are an online textbook subscription service, where you can get access to an entire online library for less than the price of a single book per month. With over 1.5 million books across 990+ topics, we’ve got you covered! Learn about our mission
Look out for the read-aloud symbol on your next book to see if you can listen to it. The read-aloud tool reads text aloud for you, highlighting the text as it is being read. You can pause it, speed it up and slow it down. Learn more about Read Aloud
Yes! You can use the Perlego app on both iOS and Android devices to read anytime, anywhere — even offline. Perfect for commutes or when you’re on the go.
Please note we cannot support devices running on iOS 13 and Android 7 or earlier. Learn more about using the app
Please note we cannot support devices running on iOS 13 and Android 7 or earlier. Learn more about using the app
Yes, you can access Frontiers Of Medical Imaging by C H Chen in PDF and/or ePUB format, as well as other popular books in Biological Sciences & Science General. We have over 1.5 million books available in our catalogue for you to explore.