![]()
Chapter 1
Overestimated Trade Surplus
•The overestimated U.S. trade deficit in Sino-U.S. trade can be explained by five main reasons: (i) issues on re-exportation (Chinese export commodities must be transferred through a third port, resulting in the statistical discrepancy); (ii) two parties offer different quotations; (iii) the caliber of the statistical district is different; (iv) customs statistics causes the repeated calculation of processing trade; and (v) a large part of the property rights in the processing trade does not belong to China.
•In the new century, globalization promotes the intra-industry division of labor, and the production chain crosses the borders for continuous expansion. The value-added products comes from different countries in the production chain, inevitably causing the repeated calculation of customs statistics with the geographical concept as the basis. To discuss trade surplus in China in accordance with the traditional customs method is similar to notching the boat to find the sword.
•The repeated calculation of the foreign value-added return of exports and the domestic value-added return of imports in processing trade using the customs statistical method, according to the customs statistics, caused the total trade volume of China to be overestimated by 16.5% in 2002 and 25.8% in 2007 and the trade surplus in China to be overestimated by 25.5% in 2002 and 33.2% in 2007. With the development of processing trade, the statistical errors caused by the repeated calculation become increasingly serious.
•The distortion of the statistics of the trade surplus using the customs method varies with the industry. The customs statistical method overestimates the trade surplus in the industries of office and computer manufacturing, electronic equipment manufacturing, instrument and meter, motor vehicle and its equipment manufacturing, general and special equipment manufacturing, and electromechanical manufacturing. Conversely, it underestimates the trade deficit in the electronic equipment manufacturing industry. In 2007, the trade surplus in the office and computer manufacturing industry was overestimated by 78.6%, whereas the trade deficit in the electronic equipment manufacturing industry was underestimated by 24.8%.
•The repeated calculation caused by using the customs method overestimates the trade surplus of China and exaggerates the trade deficit of developed countries, resulting in the misjudgment of the trade dependence among different countries. Similarly, it heightens the trade frictions between the developed and the developing countries, which is not conducive to the integration of world economy. Therefore, the import and export statistical system should be reformed urgently.
1.1. Rapid Development of the Sino-U.S. Bilateral Trade
In 2014, the foreign goods’ import and export value of China amounted to $4.3 trillion, that is, up to 3.6% over the previous year. In this statistics, goods exports reached $2.3 trillion and the goods imports reached $2.0 trillion. The trade surplus of goods was $382.4 billion. The trade surplus of China mainly comes from the processing trade, and the general trade has already had a deficit. Trade surplus has been declining for three consecutive years, with its proportion in the GDP increasing from 3.1% in 2010 to 3.6% in 2014.
Some scholars take the proportion of the current account surplus in the GDP as the indicator of the degree of trade imbalance. According to the World Economic Outlook database, the shares of the current account imbalances of China in the global imbalances increased from 6.8% in 2003 to 24.3% in 2008. It dropped slightly to 24.1% in 2009 and to around 19% recently. Some researchers assert that the current account imbalance is a major cause of the world financial crisis and that China is the first object to be criticized and attached to it.
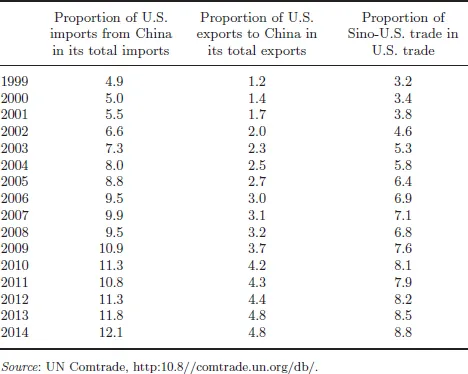
In recent years, the Sino-U.S. bilateral trade has been developing rapidly, with more than 180 times growth from 1979 to now. According to U.S. statistics, the Sino-U.S. trade volume was only $102 billion in 1999. However, it grew to $302 billion in 2005 and $649 billion in 2014, which is an average annual growth of 13.6%. The proportion of goods and service exported by China in the total imports of the U.S. increased from 4.9% in 1999 to 12.1% in 2014. The proportion of exports by the U.S. to China in its total exports was only 1.2% in 1999, but it increased to 4.8% in 2014. The proportion of Sino-U.S. trade in the total trade volume of the U.S. increased from 3.2% in 1999 to 8.8% in 2014.
In the past decade, the U.S. exports to China surged to an aggregate of 468%. In 2014, Sino-U.S. bilateral trade totaled $649.3 billion (Table 1.1). China’s imports from the U.S. were $166.6 billion. According to the U.S. Chamber of Commerce statistics, the U.S. exports to China have created more than three million job opportunities for the American people. According to the investigative report of Morgan Stanley, the commodities imported from China save about $100 for U.S. consumers, and U.S. enterprises earn $600 billion every year.1
Table 1.1: Proportion of U.S. imports from China in Its total imports and the proportion of U.S. exports to China in its total exports.
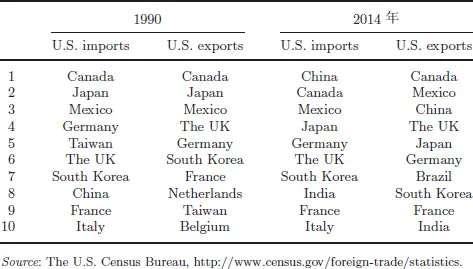
Table 1.2: Top 10 Trade Partners of the United States.
From 1997 to the Global Financial Crisis in 2008, the U.S. exports to the world increased by 53.7%, and its exports to China increased by 443.4%, which is 8.26 times faster than the former. During this period, the growth of U.S. exports to China was 1.19 times as high as the growth of its imports from China. However, the U.S. trade to the world shows the reverse situation in the same period: the growth of its imports from the world was 1.47 times higher than the growth of its exports to the world. Among the trade partners of the United States, China’s ranking is rising year by year. In 1990, China ranked No. 8 in the U.S. imports and No. 18 in the U.S. exports, but in 2014, China ranked No. 1 in the U.S. imports and No. 3 in the U.S. exports (Table 1.2).
1.2. Why Trade Deficit in U.S. Statistics is Higher than that in Chinese Statistics?
The U.S. trade deficit progressively increases with the annual increase in bilateral trade.
According to U.S. statistics, in 2000, the U.S. trade deficit with China, Japan, Canada, and the Organization of Petroleum Exporting Countries (OPEC) accounted for 19.2%, 18.7%, 1.9%, and 11%, of its total deficit, respectively. In the past decade, U.S. trade deficits with Japan and Canada declined gradually, whereas its trade deficits with the OPEC and China increased gradually. In particular, its trade deficit with China increased rapidly. According to the statistics of the U.S. Trade Department...