![]()
Part I
The Complexity of and Challenges in the Emergence of Megacities
![]()
1
THE RISE OF MEGACITIES — AN EMPIRICAL OVERVIEW OF THE DEMOGRAPHIC CHANGES IN THE WORLD ECONOMY AND AN INTRODUCTION TO AN INTEGRAL THEORY OF MEGACITIES
Jerzy Kleer and Katarzyna A. Nawrot
1.1.Introduction
The goal of this preliminary chapter is to set out an empirical analysis of the demographic changes in the world economy, especially as pertains to urban growth and the rise of megacities, while setting the background for an introduction to the theory of megacities. We set the stage for these considerations by first examining the evolution and characteristics of the demographic transformations of the world economy since 1950, as well as projections through 2100. This is followed by an empirical analysis of the rise of megacities, undertaken from different perspectives. On that basis, we next make an attempt to identify models of how various megacities arose, trying to categorize them in groups with certain characteristics. We then discuss the underlying forces driving the rise of megacities, including the major factors behind rapid population growth in such agglomerations. The chapter ends with some theoretical considerations, in an attempt to lay the groundwork for positing an integral theory of megacities, as a growing phenomenon expected to continue — bringing both challenges and opportunities — in the 21st century.
1.2.Demographic Changes in the World Economy
To understand the rise of megacities in the contemporary world economy, the unique characteristics of this process, as well as the opportunities and challenges that follow it, it is important to analyze the demographic changes occurring at the global level. Since 1950, the world population has increased dramatically, from 2.5 billion to 7.3 billion as of mid-2015, making for an almost three-fold rise. According to the median variant of UN predictions, the world population is expected to reach 11.2 billion by 2100, which will mean an increase of an additional 3.9 billion from 2015, or an overall surge of 8.7 billion as compared to 1950 (UNDESA, 2015).
The biggest increase in population from 1950 to 2015 was observed in Asia, estimated to account for around 62% of the total world population growth over the period. This surge of approx. 3 billion people in Asia alone mainly came in China and India, which saw their populations more than double and triple to reach 1.4 billion and 1.3 billion, respectively. The two countries remain the most populous in the world, together accounting for a cumulative share of 36.6% of the world population. During the same period of 1950–2015, the population increased by 957.3 million in Africa, 465.5 million in Latin America and Caribbean, 189.4 million in Europe, 186.2 million in North America, and 26.7 million in Oceania. As a result, significant changes have ensued in the structure of the world population: as of 2015, 59.8% of the world population lived in Asia (4.4 billion), followed by 16.1% in Africa (1.2 billion), and 10% in Europe (738.4 million). Latin America and the Caribbean accounted for 8.6% (634.4 million), North America 4.9% (357.8 million), and Oceania 0.5% (39.3 million). Europe’s share had decreased by more than half, from 21.7% in 1950, while Africa’s share rose by 7%, from 9.1% in 1950. UN projections further show that the greatest increase in the world population in the 21st century will occur in Africa, with a surge of around 3.2 billion expected between 2015 and 2100.1 This means that by the end of the century, 39.1% of the world population will be living in Africa and 43.6% in Asia (Fig. 1.1). For Asia, this will mean a decrease, from an around 60% share today. Europe’s share of the world population is expected to decline to less than 6%, and Northern America’s is to remain around 5%. Also, Latin America and the Caribbean’s share is projected to fall by 2.2–6.4%, and Oceania’s share will slightly rise to around 0.6% over the same period (UNDESA, 2015).
Fig. 1.1.Population of the world, Asia and Africa, 1950–2100
Explanations: 1950–2015 — estimates; 2015–2100 medium-variant projection.
Source: Authors’ own elaboration on data from UNDESA (2014), UNDESA (2015).
One of the main characteristics of the ongoing demographic changes has been the process of urbanization, occurring irrespective of the region analyzed. The share of the urban population has been constantly growing, but only in the first decade of the 21st century has it reached the share of the rural population, being estimated at around 54% (Fig. 1.2). Thus, almost 2/3 of the world population rise in 1950–2015 was concentrated in urban areas. Also, future population growth is likewise expected to be focused predominantly in urban areas, mostly in developing countries, including those least developed. Thus, we can also expect negative externalities associated with urban agglomerations, including further expansion of slums with the attendant consequences (Nawrot, 2014: 108; Nawrot, 2015: 308).
Fig. 1.2.Urban vs. rural population of the world, 1950–2050
Source: Authors’ own elaboration on data from UNDESA (2014).
Both the level and the rate of urbanization vary by region and country. High income countries are the most urbanized, while the fastest rate of urbanization is recorded in countries at a low level of development, which results from numerous factors including high fertility rates, falling mortality, and above all migrations from rural to urban areas. Regionally, the highest level of urbanization is recorded in North America (82%), Latin America and the Caribbean (80%), and Europe (74%). Africa remains the least urbanized, with 40% of its population living in urban areas. In Asia, the share is gradually approaching a balance between rural and urban inhabitants, the latter accounting for 48% in 2015. On the other hand, the rate of urbanization was the highest in Africa, followed by Asia and also Latin America and the Caribbean. The population in urban areas of Africa increased almost fifteen-fold, rising from 32 million in 1950 to 471.6 million in 2015. In Asia, an almost nine-fold increase was observed — from 244.6 million to 2.113 billion, whereas Latin America and the Caribbean saw a more than seven-fold rise — from 69.3 million to 502.8 million. This means that the largest numerical increase in population numbers living in urban areas occurred in Asia. The changes took a much lower pace in both Europe and North America, following their already high levels of urbanization in the 1950s (UNDESA, 2014).
The predictions indicate that urbanization will continue worldwide (Fig. 1.2), while still varying by region and by country. However, the overall rate of urbanization will continue to decline, with the expected level of urbanization to reach 66% in 2050. The highest rate of urbanization is projected to occur in Africa, with its population living in urban areas to reach 50% around 2040 and 80% by the end of the century. From the perspective of the analysis of megacities, two conclusions can be drawn from these projections: first, they entail a rising number of cities, including megacities, and second, they mean rising population numbers in existing megacities. Each of these two aspects will be further examined.
1.3.Demographic Rise of Megacities
In order to properly examine the demographic rise of megacities (defined here as urban agglomerations with over 10 million inhabitants), it is crucial to draw a broader picture of development of cities of different sizes. If we assume 1990 as a basis of the analysis, we can observe that the number of cities in the world with above 300,000 inhabitants increased from 976 to 1,729 over the last 25 years. This process is not expected to slow down in the years to come, and by 2030 the figure is expected to rise to 2,225. The strongest growth was observed in the category of megacities, with their number rising almost three-fold, from 10 megacities in 1990 to 29 in 2015. The number of large cities in the next category — between 5 million and 10 million — doubled during this time, with the number of still smaller cities developing at a slower pace (Fig. 1.3). These figures illustrate that the most significant changes pertained to the largest urban agglomerations. Projections indicate that the process of growth in the number of cities will continue, albeit more slowly. The rate will be still high for megacities, a category which by 2030 is expected to number 41. Moreover, the number of smaller towns — between 300,000 and 500,000 inhabitants — is projected to grow at a faster rate (Fig. 1.3).
Fig. 1.3.Global urban population growth, highlighted by different population categories of cities, in 1990, 2015, 2030
Source: Compiled by the authors based on UNDESA (2014).
The analysis of cities based on their population size gives us a different overview of the ongoing demographic changes in urban areas. The most significant rise in population was observed in megacities (Table 1.1), where the population increased more than three-fold from 152.7 million to 471.3 million between 1990 and 2015 and is projected to rise to 729.9 by 2030. The lowest rate of population increase is observed in cities of small size, with up to 300,000 inhabitants, where in the years 1990–2015 the population rose from 1.156 billion to 1.699 billion, and will increase by a further 239 million by 2030. However, most of the urban population is expected to live in cities of this category. Thus, the process of change in the population of cities depending on their size shows a quite clear upward trend in the largest cities, primarily megacities, together with a certain deceleration of growth in the smallest towns — between 300,000 and 500,000 residents (see Table 1.1).
Table 1.1.Urban population in cities of different population categories in 1990, 2015, 2030 (in million)
Source: Compiled by the authors based on UNDESA (2014).
Thus, according to existing forecasts, there is every indication that cities will account for around 66–76% of the world’s population, or more than 6.3–7.3 billion people, in 2050. Regardless of the exact size of that population, one thing is certain: megacities will become home to more and more of humanity. Already in 2010, megacities accounted for more than 5% of the world’s population, with their number standing at just 23. Even if we assume that the number of megacities will not exceed 50 in 2050 and the average population of each megacity will not exceed 20 million inhabitants, this still means approx. 10% of the global population will be living in megacities by that time.
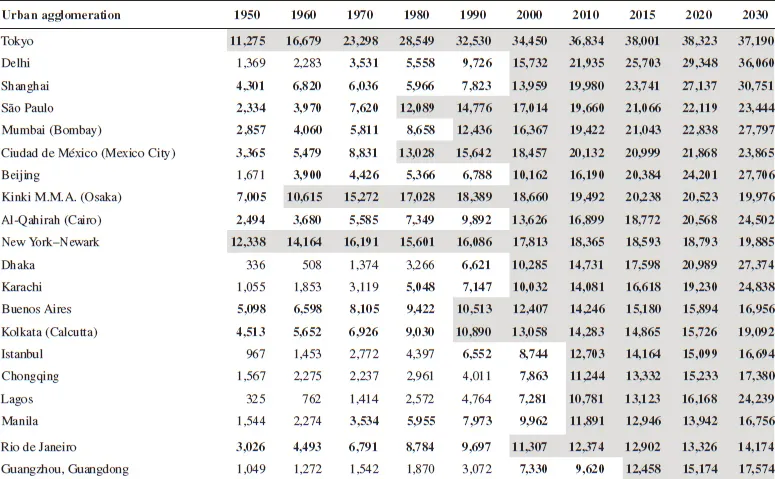
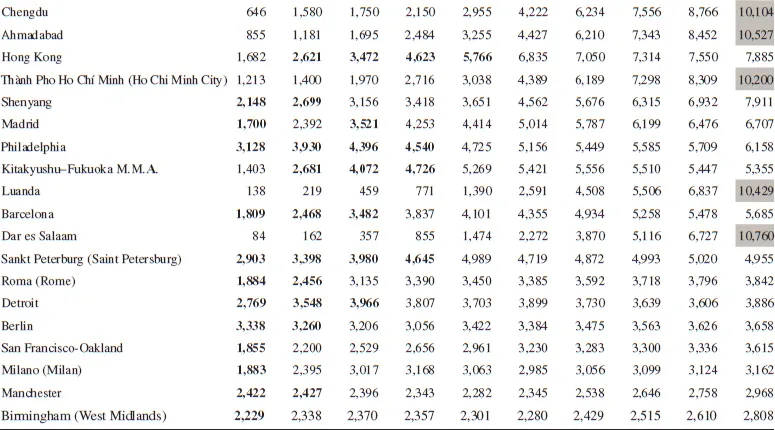
If we look more closely at the above-presented demographic changes in world cities, it is interesting to observe that in 1950 there were two megacities — New York–Newark and Tokyo–Yokohama, then with 12.3 and 11.3 million inhabitants respectively (Table 1.2). In the ranking of the largest cities they were followed by London (8.4 million), Osaka (7 million), Paris (6.3 million), and Moscow (5.4 million). The list of the largest urban agglomerations (the top 30) then also included four Latin American cities — Buenos Aires (5.1 million), Mexico City (3.4 million), Rio de Janeiro (3.1 million), San Paulo (2.3 million); one African city — Cairo (2.5 million); five Asian cities — Kolkata (4.5 million), Shanghai (4.3 million), Mumbai (2.9 million), Tianjin (2.5 million), and Shenyang (2.2 million); four cities in the US — Los Angeles (4 million), Philadelphia (3.1 million), Detroit (2.8 million), and San Francisco (1.9 million), and eight in Europe, including Berlin (3.3 million), St. Petersburg (2.9 million), Manchester (2.4 million), Birmingham (2.2 million), Rome (1.9. million), Milan (1.9 million), Barcelona (1.8 million), and Madrid (1.7 million). This clearly shows how urbanization was then mostly concentrated in Europe.
Osaka joined the group of megacities in the 1960s, with a population of 10.6 million, followed by Mexico City and San Paolo in the late 1970s. In 1990, five additional megacities were recorded — Mumbai, Kolkata, Los Angeles, Seoul, and Buenos Aires. At the beginning of the 21st century they were further joined by Delhi, Shanghai, Cairo, Rio de Janeiro, Dhaka, Beijing, Karachi, and Moscow. There were then 17 megacities altogether (as Seoul fell out of the ranking) with a cumulative population of 255.1 million (see Table 1.2).
According to UNDESA (2014), there were 29 megacities in 2015, ranging from Bangalore (10.1 million) and London (10.3 million) to Shanghai (23.7 million), Delhi (25.7 million), and Tokyo (38 million) — the latter remaining the biggest megacity uninterruptedly since 1954. By 2030, the group of megacities is set to increase by another 12 agglomerations including Chennai (then with 13.9 million), Lahore (13 million), Hyderabad (12.8 million), Lima (12.2 million), Bogota (12 million), Johannesburg (11.6 million), Bangkok (11.5 million), Dar es Salaam (10.8 million), Ahmadabad (10.5 million), Luanda (10.4 million), Ho Chi Minh City (10.2 million), and Chengdu (10.1 million).
Table 1.2.The demographic trajectories in 1950–2030 of world’s cities by population (population in thousands)
Explanations: Values in bold mark the status of being among the world’s 30 largest cities in the given year; values shaded grey mark the status of megacity in the given year; the table is structured according to the population size of the cities in 2015.
Source: Authors’ own elaboration on data from UNDESA (2014).
These facts concerning the rise of megacities since 1950 allow us to identify a few important trends, namely: (i) an increasing pace at which new megacities are emerging; (ii) the changing dynamic of their development depending on the region and level of development of the countries involved; and therefore (iii) a significant shift in their geographical location. Certain regularities can be identified from the ongoing demographic transformation.
First, in the 1950s and 1960s, megacities were concentrated in Europe, the US, and Japan. In terms of locat...