- 248 pages
- English
- ePUB (mobile friendly)
- Available on iOS & Android
eBook - ePub
About this book
The revised edition of Understanding Records explains the musical language of recording practice in a way any interested reader and student can easily understand. Drawing on readily available hit records produced since 1945, each section of this book explains a handful of core production and engineering techniques in chronological record-making sequence, elucidates how those techniques work, what they sound like, how they function musically, where listeners can hear them at work in the broader Top 40 soundscape, and where they fit within the broader record-making process at large. As the only book to introduce music production and its practical elements with no assumed prior knowledge, the revised edition includes:
· Exclusive print and video interviews with emerging and established recordists, including: Alex Chuck Krotz (Drake, Three Days Grace, Mother Mother); Kevin O' Leary (Shawn Mendes, The Glorious Sons, Monster Truck); Alastair Sims (Rush, The Tragically Hip, Barenaked Ladies); Matt Shelvock (kingmobb, san holo, bitbird, DROLOE); and Russ Hepworth-Sawyer (Billy Ray Cyrus, Steve Earle, Amadou & Miriam)
· Numerous "real word" audio examples, organized into easily accessible streaming playlists, culled from Juno-nominated sessions the author himself worked on, and numerous other professional sources.
· Easy to understand explanations of each facet of the record production process, which avoid technical jargon and clarify terminology.
· Information on new developments in recording practice and updated musical references.
Completely reworked and expanded sections on mixing and audio mastering.
Tools to learn more effectively

Saving Books

Keyword Search

Annotating Text

Listen to it instead
Information
1
Tracking (Making Audio Signals)
When recordists track a record, they create the raw audio signals which they later shape into a so-called “master cut,” ready for streaming and physical release, using a range of signal processing, mixing, and mastering techniques. The material form this raw audio signal takes depends completely on the technology recordists used to create and store it. If they use an Edison cylinder phonograph, for instance, recordists create raw audio signal in the form of bumps and pits on a wax-cylinder. If they use a computer, on the other hand, the raw audio signal they make takes shape as a digital sequence of binary code.
The number of separate audio signals, called “tracks,” which can be combined into a “master cut” also depends on technology. Early acoustic devices, like the phonograph and the gramophone, had only one track available for recording. Tape machines, which are electromagnetic devices, eventually expanded that number from two to sixty-four (and more) available tracks. And now, with the advent of digital-audio (computer-based) recording technology, recordists can create and combine a theoretically unlimited number of tracks. Regardless of the technology they use, though, recordists have only three fundamental techniques at their disposal for tracking records, namely (i) transduction, (ii) direct-injection (DI), and (iii) sequencing. Transduction remains the most common of these techniques and, accordingly, warrants immediate attention. A brief explanation of DI and sequencing techniques follows.
Transduction
Transduction, or the conversion of one kind of energy into another kind of energy, is the technical basis of tracking. The three most iconic recording technologies—microphones, headphones, and speakers—are, in fact, transducers. Microphones transduce (convert) acoustic energy into alternating current, which is electrical energy, while headphones and loudspeakers transduce electrical energy back into acoustic energy.
A number of variables mediate every transduction. First among these mediating variables are microphones. Each microphone has a biased way of hearing sound, which recordists call its “frequency response.” Some microphones exaggerate, while others attenuate, certain frequencies, while still others only transduce sounds coming from particular directions. Variations in frequency response are vast, and seemingly endless. Given the crucial role that microphones play in the tracking process, it should come as no surprise to discover that these variations guide the microphone selection and placement processes in their entirety.
To understand the almost total influence frequency response exerts over the tracking process—and, in turn, to understand the crucial role that microphone selection plays in determining the final audible character of tracks on a record—readers must first understand what it is that frequency response shapes, namely, a so-called “sound source.” Thus, I will explain the concept of a sound source before I elucidate the microphone selection process. Readers who are already familiar with the physics of sound should feel free to skip ahead to the following section of this field guide, headed “Microphone selection, I.”
Sound source, soundwave, and waveform
A sound source is a vibrating physical object—no more, no less. As objects vibrate, their back-and-forth motions displace the air molecules surrounding them, forcing them to compress (bunch together) and rarefy (thin apart) in recurring patterns called “soundwaves.” The vibrational energy of the sound source is rapidly conveyed from air molecule to adjacent air molecule in the form of a soundwave until it reaches, for my purposes, human ears or a microphone. The tympanic membrane in the human ear vibrates in sympathy with soundwaves, which is to say, the membrane moves back and forth at a rate which is directly proportional to the vibration of the sound source itself. Through a complex electrochemical process, this sympathetic back-and-forth motion creates a sequence of electrical impulses which, in turn, the brain interprets as sound. With microphones, a diaphragm rather than a tympanic membrane sways sympathetically with the changes in air pressure that a soundwave creates. This sympathetic motion is then translated into alternating positive and negative charges of electrical current, which is transmitted by cables through routing technology (e.g., mixing consoles), processing technology (e.g., compressors and equalizers (EQs)), and, ultimately, to storage technology (e.g., tape machines and computers).
Recordists visualize soundwaves as “waveforms” (see Figure 1.1). Waveforms graph the changes in air pressure that characterize a soundwave. The horizontal axis of a waveform represents time, while the vertical axis represents changes in air pressure. Therefore, the pushing-and-pulling energy of a soundwave is flipped onto its side in a waveform graph and is represented as an up-and-down motion along the vertical axis. Upward motion along the vertical axis of a waveform represents compressions of air molecules, while downward motion represents rarefactions. The horizontal axis delineates the time it takes for each successive compression and rarefaction to occur.
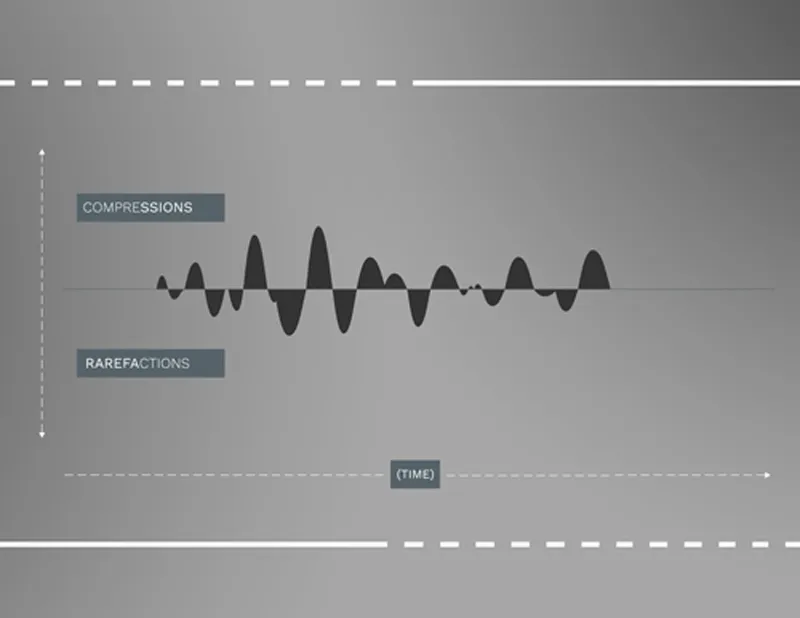
Figure 1.1 A waveform representation of the changes in air pressure produced by plucking the bottom string of an acoustic guitar.
The vertical expanse of a waveform, which recordists call “amplitude,” delineates the total displacement of air molecules a soundwave generates. As such, amplitude represents the total displacement power of a soundwave. This displacement power is usually measured in decibels (dB), which is a unit of measurement named after an often overlooked pioneer of the recording process: Alexander Graham Bell (this is why the “B” in “dB” is usually capitalized). Decibels are groupings of ten “bels,” with each “bel” defined as a common logarithm of two powers. Accordingly, when one power is ten times another, it is said to be 1 dB more powerful. A 100 horsepower (hp) engine is 1 dB more powerful than a 10 hp engine, for instance, while a soundwave ten times more powerful than another is said to be 1 dB louder.

Figure 1.2 A close-up of the waveform from Figure 1.1, with peak compression and rarefaction amplitudes noted.
Contrary to popular belief, amplitude doesn’t measure “loudness.” Amplitude roughly equates with “volume,” which designates, for my purposes right now, the peak dB a waveform is set to reach. Loudness, on the other hand, is a subjective impression of a sound created by a number of characteristics, not least of which being so-called “average amplitude” or the amount of time a waveform spends at or near its peak volume. If a sine waveform and a square waveform are both set to peak at the very same volume (see Figure 1.3), the human ear nonetheless hears the square waveform as louder. This is because the square waveform spends almost all of its time at or near peak volume, while the sine waveform only quickly slides by that mark.
Recordists refer to the difference between the peak amplitude of a soundwave and its average amplitude as its “crest factor.” “Transient,” or percussive, sounds usually exhibit a greater crest factor, that is, they exhibit a greater difference between their peak and base amplitudes, than do sustained sounds. Waveforms which spend all or most of their time at peak amplitude, on the other hand, like the so-called “square wave” in Figure 1.3, exhibit practically no crest factor at all.
Demonstration tracks and playlists: Spotify
At this point in the chapter, I would like to direct readers to the various playlists on Spotify, which I reference throughout this book. These playlists contain audio examples designed to demonstrate and aurally concretize the concepts I explore in the following pages, or comprise commercially released tracks that nicely demonstrate how some concept or technique has played out in the creative practice of recordists. I have used Spotify to house these playlists for a number of reasons, but the most salient is that its freemium model allows for free use without any term limits, and thus I can be reasonably certain that readers will be able to avail themselves of these audio materials for as long as Spotify continues to operate.

Figure 1.3 A “sine wave” (above) and a “square wave” (below).
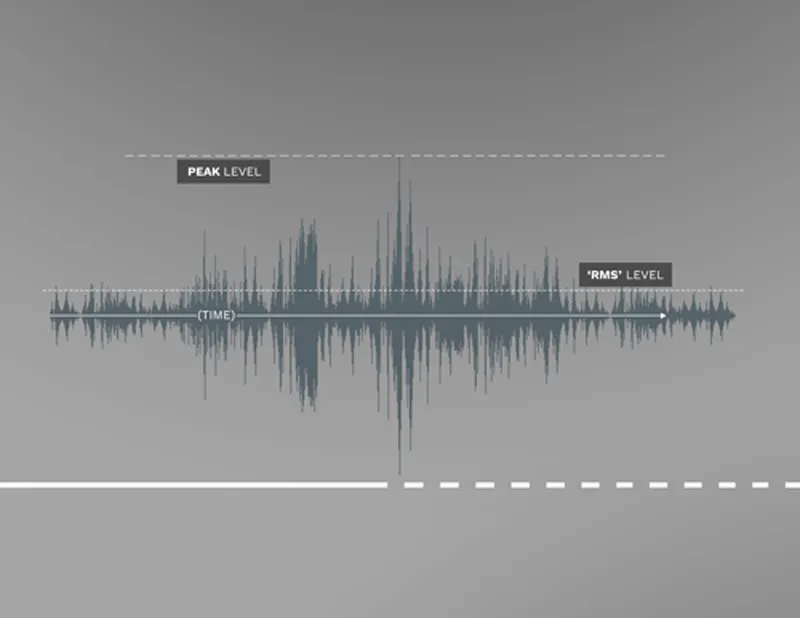
Figure 1.4 Crest factor refers to the distance between a waveform’s peak amplitude (peak level) and its average amplitude (RMS level).
As I noted in the introduction for this book, it is crucial, to my mind, that readers listen to the audio examples—and, as I’ll note later, view video materials on YouTube—when prompted in the reading. Indeed, the audiovisual materials I have created for this book are not meant as accompaniment but, rather, as crucial parts of a broader whole. It is only by learning to hear musical techniques at work that the concepts which underpin them take on any creative meaning, and this is the only meaning that has relevance, as far as I am concerned.
Given that this is the first time readers are asked to navigate their way to one of these playlists in the body of this field guide, I will explain how they should interpret the suggestion. I...
Table of contents
- Cover
- Half-Title
- Title
- Contents
- Acknowledgments
- Introduction
- 1 Tracking (Making Audio Signals)
- 2 Mixing (The Space of Communications)
- 3 Mastering (The Final Say)
- Coda (Fade-Out)
- Notes
- Index
- Copyright
Frequently asked questions
Yes, you can cancel anytime from the Subscription tab in your account settings on the Perlego website. Your subscription will stay active until the end of your current billing period. Learn how to cancel your subscription
No, books cannot be downloaded as external files, such as PDFs, for use outside of Perlego. However, you can download books within the Perlego app for offline reading on mobile or tablet. Learn how to download books offline
Perlego offers two plans: Essential and Complete
- Essential is ideal for learners and professionals who enjoy exploring a wide range of subjects. Access the Essential Library with 800,000+ trusted titles and best-sellers across business, personal growth, and the humanities. Includes unlimited reading time and Standard Read Aloud voice.
- Complete: Perfect for advanced learners and researchers needing full, unrestricted access. Unlock 1.4M+ books across hundreds of subjects, including academic and specialized titles. The Complete Plan also includes advanced features like Premium Read Aloud and Research Assistant.
We are an online textbook subscription service, where you can get access to an entire online library for less than the price of a single book per month. With over 1 million books across 990+ topics, we’ve got you covered! Learn about our mission
Look out for the read-aloud symbol on your next book to see if you can listen to it. The read-aloud tool reads text aloud for you, highlighting the text as it is being read. You can pause it, speed it up and slow it down. Learn more about Read Aloud
Yes! You can use the Perlego app on both iOS and Android devices to read anytime, anywhere — even offline. Perfect for commutes or when you’re on the go.
Please note we cannot support devices running on iOS 13 and Android 7 or earlier. Learn more about using the app
Please note we cannot support devices running on iOS 13 and Android 7 or earlier. Learn more about using the app
Yes, you can access Understanding Records, Second Edition by Jay Hodgson in PDF and/or ePUB format, as well as other popular books in Media & Performing Arts & Music. We have over one million books available in our catalogue for you to explore.