![]()
1
Bruce R. Beattie
The Disappearance of Agricultural Land: Fact or Fiction?
The disappearance of agricultural land—specifically, the loss of prime agricultural land—has been a concern in the United States for a long time. Dating back at least to the end of the homestead era, politicians and their constituencies have regularly proclaimed impending doom if we didn’t start paying serious attention to the preservation of our soil and land resource base for agriculture. Consider, for example:
[Farmland protection is] … our most pressing environmental issue.
—President Richard M. Nixon, 1973
In my lifetime, we’ve paved over the equivalent of all the cropland in Ohio. Before this century is out, we will pave over an area the size of Indiana…. Continued destruction of cropland is wanton, squandering of an irreplaceable resource that invites future tragedy not only nationally, but on a global scale.
—Secretary of Agriculture Bob Bergland, 1979
Such comments by leaders over the years have resonated with most Americans. I remember my father, when I was a child of seven or eight, expressing heartfelt concern about how the new road from Hilger to Lewistown, Montana, a distance of some 15 miles, was cutting right through the middle of Charlie Foster’s wheat field and Bud Vanek’s hay meadow. And I recall, during my undergraduate years at Montana State College, my own distress about the construction of I-90. The wide swath it was cutting through fertile bottom land along the Yellowstone River from Billings to Livingston, and its mindless and relentless path through beautiful ranches and hay meadows along Billman Creek from Livingston to the top of Bozeman Pass en route to Butte and beyond, seemed unforgivable to me.
Such feelings are motivated by various concerns, some implicit and some explicit, in the unending agricultural land-preservation debate. The concerns include maintenance of open space, preservation of rural lifestyles, preservation of local agricultural economies, prevention of urban sprawl, environmental protection (including watershed protection, air quality, and retention of natural systems), and retention of food and fiber production capacity (Heimlich, Vesterby, and Krupa 1991). Localized, firsthand experiences and backgrounds motivate these concerns and influence individual perceptions about them and the intensity with which they pull at our heartstrings. Each of us comes from a different local reference point armed with personal anecdotal data. It is not surprising, therefore, that Americans, easily and quite naturally, jump to the conclusion that there surely must be a problem of inadequate agricultural land looming around the corner.
Despite varied motivations for agricultural land preservation, my specific assignment is to assess the validity of the land base adequacy concern vis-à-vis maintenance of U.S. agricultural capacity. Therefore, this chapter explores three interrelated questions: (1) What is happening to real (inflation-adjusted) prices of agricultural products, and what is the implication for the value of land for agricultural purposes? (2) Is agricultural land disappearing in the United States? (3) Is U.S. agricultural productivity on the decline or rise, and what is the implication for U.S. agricultural capacity?
The first question is briefly addressed in the next section. A simple two-period supply-and-demand model is proposed, and the trend in historical farm-gate prices for raw agricultural commodities is discussed. Implications for the value of and need for farmland are considered. In addressing the second question, historical data for agricultural and nonagricultural land uses are then presented; this is followed by a discussion of cropland data and trends; and finally the issue of farmland losses to urbanization is considered. Later in the chapter, the matter of agricultural productivity is considered, first in terms of output relative to all inputs utilized in agriculture (total factor productivity) and then more narrowly in terms of land resource productivity, namely, crop output per acre. A final section summarizes and concludes. Having exposed the twin myths of impending U.S. agricultural capacity shortfall and shortage of agricultural land, possible alternative rationale and motivation for agricultural land preservation are explored as an epilogue.
Demand, Supply, and Farm Commodity Prices
Aside from the complexities of farm price and income support programs, the value of land for agricultural purposes is driven primarily by the prices that farmers and ranchers receive for the products they produce. These product prices are ultimately determined by the market supply and demand for food and fiber (both domestic and international components). As with markets for all economic goods, events/factors that cause demand to increase will cause the price of those goods to rise. This fact lies at the heart of the farmland-preservation argument.
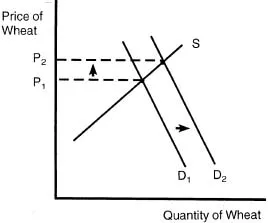
Figure 1.1 presents the farmland-preservation argument in the form of a first-principles, supply-and-demand diagram. In the figure, S represents the supply curve for some U.S. agricultural product, such as wheat; D1 is the demand curve for wheat in time period one; and D2 is the demand curve in time period two. D2 is positioned to the right of D1 for two reasons. First, the diagram supposes that in period two U.S. and world population has increased relative to period one (more consumers of wheat); second, the diagram supposes that U.S. and worldwide household income has improved between period one and two and that wheat is what economists call a normal good. (Normal goods are goods that consumers demand more of when their incomes rise.) No one questions that U.S. and world population has increased with the passage of time, and it is also true that per capita incomes have risen (to varying degrees) around the world. So, if demand expands (shifts to the right), as it must under such circumstances, what then must happen to price, other things constant. Easy—price will increase (from P1 to P2 in Figure 1.1), reflecting the fact that wheat is more valuable in period two than it was in period one because demand has increased relative to supply.
Figure 1.1 Two-period model of supply and demand for wheat, with demand expansion in period two.
But what do we know about the historical trend in real prices of wheat and other agricultural commodities? Sadly, from the point of view of producers, the real price of most agricultural commodities has fallen, not risen, over time. Bruce Gardner (1992), in an insightful paper titled “Changing Economic Perspectives on the Farm Problem,” includes a graph of the composite index of real prices received by U.S. farmers for crops and livestock from 1910 through 1989, with 1982 as the index base year (1982 = 100). If one disregards the World War II and earlier period (including the Great Depression), what is revealed is that composite real prices received by farmers dropped rather precipitously from an index value of about 198 in 1945 to about 88 in 1989. Assuming I have interpreted Gardner’s graph correctly, the decline amounts to something to the order of 56 percent, with the 1989 overall inflation-adjusted price index being about 44 percent of that received by farmers at the peak of the post-World War II “boom.” Gardner (1992, 64) notes, “Every one of the major individual commodities shows a similar downward trend.” Two colleagues and I recently made some similar calculations for real prices received for the principal field crops in Arizona. For upland cotton, we found a real price decline from 1945 to 1994 of 67 percent; a 73 and 71 percent decline, respectively, for wheat and barley; and a 49 percent drop in the real price of alfalfa hay (Beattie 1998).
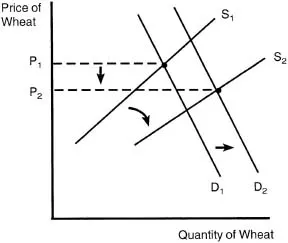
So what then is wrong with Figure 1.1? How can it be fixed to reflect what has in fact happened in agricultural markets through time? How can we get P2 to be less than, rather than greater than, P1? Figure 1.2 is a reproduction of Figure 1.1 with one added feature; specifically, a shift in supply is included along with the shift in demand. In Figure 1.2, a rightward/downward shift in the supply curve for wheat is shown to reflect increased productivity (lower real cost) in the production of wheat from period one to period two. Now we have a picture/story that is consistent with all the facts—increased population, improved household income, and improved agricultural productivity. What is shown in Figure 1.2 is a lower price in period two than in period one, suggesting that productivity growth (supply expansion) has outpaced demand growth.
Trends in real prices tell a great deal about supply relative to demand. Rising real prices suggest tightness in supply relative to demand, while falling real prices suggest excessive supply capacity relative to effective demand. Unfortunately, for agricultural land preservationists, falling product prices suggest that the demand (need) for inputs to produce those products will fall, other things constant. Land is no exception—when agricultural product prices fall, the demand for and value of land for agricultural purposes will fall in turn.
Figure 1.2 Two-period model of supply and demand for wheat, with both demand and supply expansion in period two.
The next two sections show that, contrary to popular opinion, cropland acreage in the United States has not changed appreciably during the past half century, and its productivity (and the overall productivity of U.S. agriculture) has increased at an astonishing rate. The incredible success story of rising U.S. agricultural productivity, and the fact that land is but one of many interchangeable (substitute) inputs in agricultural production, flies in the face of the case for agricultural land preservation to meet foreseeable food and fiber demand.
Land Use Data
To assess the validity of the claim that agricultural land is disappearing in the United States, this section presents and discusses historical land use data from 1945 through 1992 for agricultural and nonagricultural categories and for cropland. Loss of agricultural land to urbanization is also discussed. To complete the picture, the quality (productivity attributes) of cropland lost is contrasted against the quality of cropland gained over time. This comparison speaks to whether new cropland coming on-line is of lower innate quality than cropland annually succumbing to urban uses.
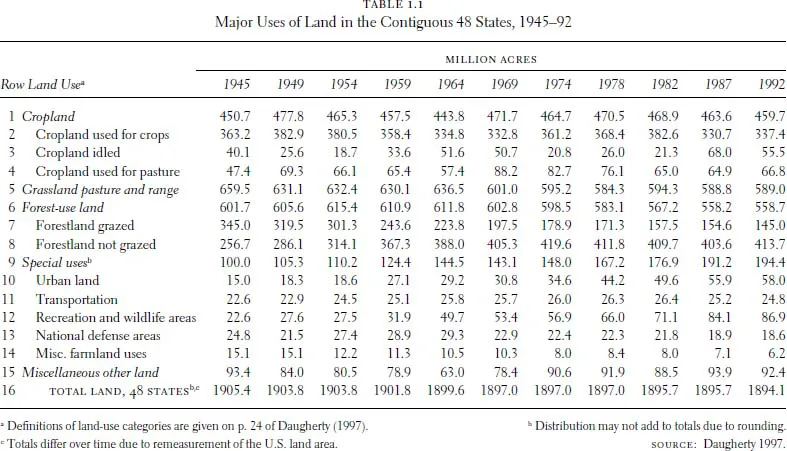
The U.S. Department of Agriculture’s (USDA) Economic Research Service (ERS) regularly researches and analyzes data on land, water, and other production inputs used in agriculture. The data presented draw extensively from the land-use chapter of USDA/ERS Agricultural Handbook No. 712, Agricultural Resources and Environmental Indicators, 1996–97 (Daugherty 1997). Table 1.1.2 (Major uses of land in the contiguous 48 states, 1945–92, from Handbook 712), reproduced here as Table 1.1, provides most of the data needed to address the disappearance issue.
Across the top of the table are agricultural census years, from 1945 through 1992. (Data for 1997 are presently being developed and verified by ERS economists.) The left column lists major agricultural and nonagricultural land-use categories. The principal interest of this chapter is the first row—cropland.
But first, starting at the bottom of Table 1.1, there are about 1.9 billion acres in the 48 contiguous states (last row). In 1992 (last column), roughly 92 million of these acres were classified as miscellaneous other land (row 15). This miscellaneous category, mostly marshes and swamps that have little or no other surface use and comprise only a small portion of the nation’s wetlands, has changed little, on balance, between 1945 and 1992. Continuing up the table: In 1992, 6.2 million acres were in miscellaneous farmland uses (farmsteads, on-farm roadways, buildings and facilities; row 14); 18.6 million acres were devoted to national defense facilities (row 13), down considerably from 29.3 million acres in 1964; about 87 million acres were dedicated to recreation and wildlife uses, which has grown significantly since 1945 (federal and state parks, wilderness areas, and wildlife refuges; row 12); about 25 million acres were devoted to nonurban transportation facilities (rural roads and highways, railroad rights-of-way, and rural airports; row 11); and 58 million acres were in urban uses (row 10). These mostly nonagricultural uses, called special uses, comprised 194.4 million acres in 1992 (row 9).
That completes our consideration of the nonagricultural part of Table 1.1, for now. We will return later to the urban land-use numbers (row 10). The next category, forest-use land, can be dispensed with quickly, not because it is unimportant, but because it has not changed much, despite what the figures in row 6 suggest. Most of the apparent decline in forest-use land between 1945 and 1992 is due to reclassifi-cation over the years from forest-use land to recreation and wildlife areas, specifically forested land dedicated to parks, wilderness areas, and wildlife reserves.
Grassland pasture and range acres (row 5), the largest use category, accounted for 31 percent of total land use in 1992—more or less steadily downward from 35 percent in 1945. But grassland pasture and range is not what is bothering most people concerned about agricultural land preservation (except for a few wannabe cowboys like me). The gut issue of the farmland-preservation debate centers on cropland—in particular, cropland versus urban sprawl.
Cropland Quantity
The cropland data are revealing. Total cropland (row 1) consists of cropland used for crops, cropland idled, and cropland used for pasture. Cropland used for crops includes harvested acres of row crops, field crops, hay and silage, tree fruits, small fruits, berries, tree nuts, vegetables and melons, and miscellaneous minor crops; also included are planted acres, which for various reasons were not harvested, and cultivated summer fallow. Because of producer response to changes in relative crop and livestock prices and compliance with set-aside requirements and other land-idling provisions/incentives of various farm programs, there is understandable motion in the data from census year to census year among the three subcategories of cropland. But what is most striking and germane is the stability of total cropland acres over the years. One might surmise that this stability is surprising (maybe even troubling) to farmland preservationists. Between 1945 and 1992, cropland acres actually increased by 9 million acres, or by 2 percent. From 1959 to 1992, cropland acres increased ½ of 1 percent; and between 1964 and 1992, cropland acreage was up by 3.6 percent. To be fair, cropl...