![]()
Chapter 1
Introduction
1.1 Background
Coastal zone is an area of interaction between land and sea which include renewable and non-renewable resources. Hence, the interaction between various natural processes and human activities are important factors in the coastal area for its sustainable development. The dynamic coastal environment is dictated by the major driving forces due to wind, waves, tide and current and the resilience characteristics of the coastal morphology. The need for the engineering development necessitates the development of many systems such as coastal protection measures, harbour structures, river training walls, intake well and outfall systems which may further influence the coastal behaviour. Among all the parameters needed for the design of structures in the marine environment, the effect of ocean waves play a dominant role in dictating the system design.
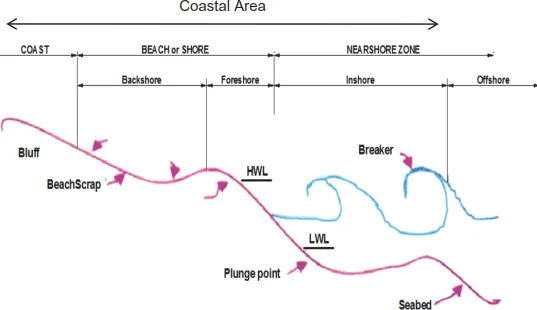
Beaches are formed by the sediments driven from the seabed by the ocean waves that undergo different types of transformation prior to breaking near the coast. The sediments in the seabed are picked up by the waves when they feel the sea bottom. Its movement then depends on the characteristics of the sediments as well as that of the waves. Sandy beaches extend from the outermost breakers to the landward limit of normal wave and swash action. A typical beach profile and the terminology adopted in defining are shown in Fig. 1.1. The wave energy incident on the beach dictates its profile. The beach in general constitutes the backshore, the foreshore, the portion sloping toward the ocean; and the nearshore, There could be a line of breakers or a region of wave breaking, the region, where, the wave induced sediments are in suspension that are driven along the shore by alongshore currents or tend moving along the cross shore. The movement of sediments along the coast will be dominated in the surf zone, that is, between the shoreline and the breaker zone.
Fig. 1.1 Terms used in defining beach profiles.
In general, high waves with short periods cause the beach to erode, and the berm sand is shifted offshore to the bar. Low waves with longer periods, move sand from the bar and return it to the berm.
1.2 Behaviour of Waves
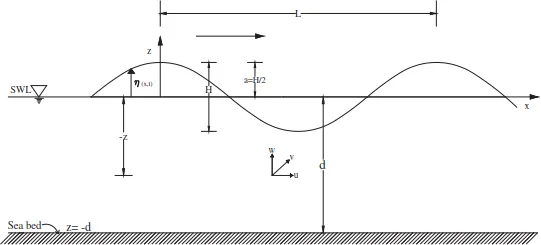
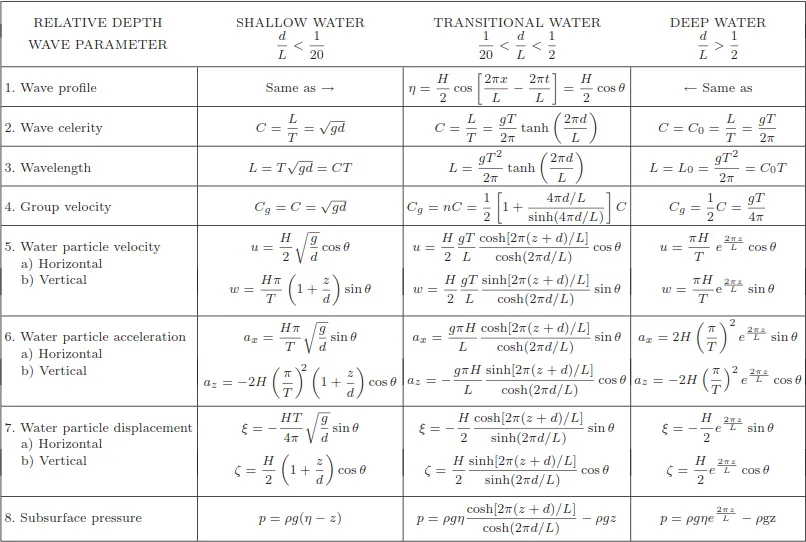
Ocean waves are oscillatory in motion with a height, H and length, L propagating with a speed, C in a water depth, d. The time taken for a wave to travel one wavelength defined as wave period is “T ” the pictorial representation of which is as shown in Fig. 1.2. Linear wave theory is the basic theory of ocean surface waves used in ocean and coastal engineering and naval architecture. The sine (or cosine) function defines what is called a regular wave.
A summary of the linear wave theory as per the Coastal Engineering manual (2002) is reproduced in Table 1.1.
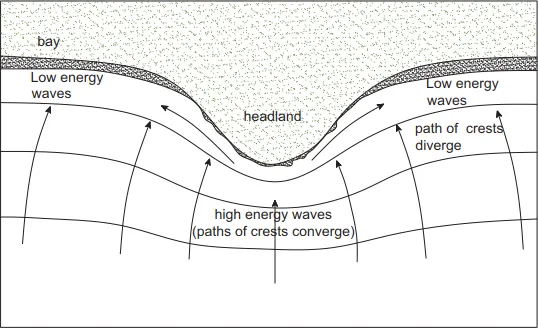
Ocean waves traveling in the offshore with no net gain or loss of energy will propagate in straight lines with a constant speed. However, while they propagate from offshore towards the coast undergo deformation due to the variations in the bathymetry, nature of the seabed like friction and presence of structures, interaction of currents and winds. These deformations in general are broadly classified as shoaling, refraction, diffraction, reflection and breaking which are briefly discussed herein. For a comprehensive discussion on the basics of wave motion the readers are suggested to refer Sundar (2015) and any other books.
Fig. 1.2 Definition sketch for wave motion.
1.2.1 Shoaling
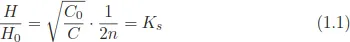
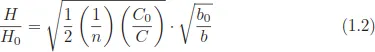
When waves propagate over a sloping seabed with bottom depth contours being parallel, its length decreases. The power transmission in a wave is proportional to CgH2. In case of pure shoaling, it is considered that the energy transfer is in the direction of propagation and there is no transfer of power in the lateral direction, i.e., normal to the wave direction. On assumption that there is no energy loss and by equating the average energy flux in deep-water, P̅ 0 = 1/2E0C0 to that in shallow waters, P̅ = E̅Cg the relationship between the wave heights in deep and shallower waters can be defined as
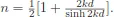
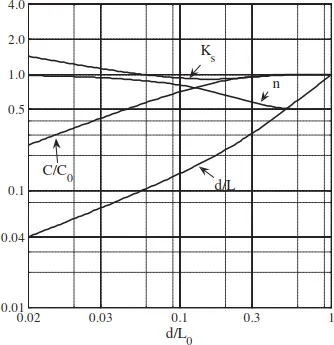
The relationship in Eq. (1.1) shows that as the waves propagate from deep to shallow waters, its height will gradually increase. The variations of Ks, n, C/C0 and d/L as a function of d/L0 for small amplitude waves are shown in Fig. 1.3. Herein, L, L0 = 1.56T2, C = L/T and d, are the wavelength in a given depth, deep water wave length, celerity or speed of the wave and water depth respectively. T is the wave period.
Table 1.1. Basics of linear wave theory.
Fig. 1.3 Properties of small amplitude waves.
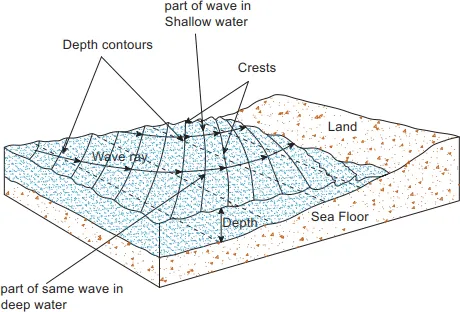
1.2.2 Refraction
It was assumed that energy is transmitted only in the direction of wave propagation under the phenomenon of “shoaling”. However, due to large variations in the seabed contours, the waves will start bending as the portion of the wave crest in deeper waters will move faster than the portion of the same crest in shallower waters. This phenomena defined as wave refraction is illustrated in Fig. 1.4.
We can consider a point on a wave front in the offshore and traverse this point towards the shore, which basically represents the wave direction. If we identify yet another point on the same wave front in the offshore separated by a distance, b0 and trace its movement, it obviously will be separated by a distance “b”, the relationship between b0 and b that could be derived from the famous Snell’s law will be governing the behaviour of the waves in the near shore. Equating the power in deep and shallower waters along with the respective directions of the wave, the relationship between the wave heights in the offshore and shallow waters can be derived as
Fig. 1.4 Phenomena of wave refraction.
Herein,
is the refraction coefficient will be unity for constant water depth. If it is greater than unity along a certain stretch of the coast, the energy gets amplified leading to erosion, whereas, if it is less than unity, that certain stretch of the shoreline is expected to advance towards the ocean.
In the planning stage of any coastal development program along a stretch of a coast, it is usual to construct a refraction diagram that superposes the bathymetry and the direction of the wavefront from offshore to the shore for a particular predominant wave height, period and direction. A typical refraction diagram shown in Fig. 1.5 provide information on the zones of erosion and deposition of sediments which is vital for the coastal development.
1.2.3 Diffraction
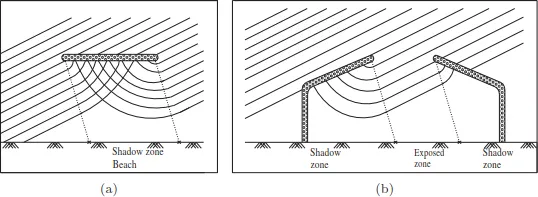
When the energy from water waves is transferred laterally along the wave crest i.e., normal to the wave direction, the phenomenon is called wave diffraction. It is dominant around natural barriers or man-made structures such as breakwaters, groins, training walls, etc. The waves curve around the barrier and penetrate into the sheltered area. Sample wave diffraction patterns for a single and a pair of breakwaters are illustrated in Figs. 1.6(a) and 1.6(b) respectively.
Fig. 1.5 Typical refraction diagram.
Fig. 1.6 Diffraction of waves around (a) single breakwater (b) a pair of breakwaters.
1.2.4 Breaking
The waves can break either in the offshore in which case the breaking is steepness limited or in the nearshore in which case it is “depth limited”. Transfer of excess of energy from wind to the ocean surface in the offshore facilitate breaking of waves. The waves when propagating from offshore to the coast undergo the near shore phenomena like, shoaling refraction or diffraction or a combination of these phenomena. When the waves reach the near shore, it usually steepen while its length reduces resulting in the waves breaking. The most widely adopted criteria for the wave to break are listed below.
(1) When horizontal particle velocity at the crest exceeds the celerity of the wave.
(2) When vertical particle acceleration is greater than acceleration due to gravity.
(3) When crest angle is less than 120◦.
(4) When the wave steepness, H/L > 0.142 tanh kd and for deep waters tanh kd will become 1.
(5) When wave height is greater than 0.78d.
The characteristics of the beaches depend also on the type of wave breaking, which in turn, depend on the wave steepness and the beach slope. It is characterised as per the parameter,
N1 = tan
The breaker types namely spilling, plunging, surging and collapsing dictates the extent of mixing of sediments in the breaker zone.
When waves of low steepness waves break over beaches of mild slopes, spilling breakers are generated in which case N1 is less than 0.5. Breaking is gradual and is by continuous spilling of foam down the front face sometimes called as “white water”. Such breakers are expected to move fine sediments on to the beach. Plunging breakers occur when waves of medium steep break over beach of medium steepness. The waves at breaking curl over. The breaking is instant and N1 = 0.5 to 3.3. The beaches are characterized by well mixed sediments as they are churned due to the turbulence induced during breaking. Surging breakers occur with the steepest waves breaking over steep slopes. The base of the wave surges up the beach generating considerable foam. It builds up as if to form the plunging type. For this type of breake...