Analyze key indicators more accurately to make smarter market moves
The Economic Indicator Handbook helps investors more easily evaluate economic trends, to better inform investment decision making and other key strategic financial planning. Written by a Bloomberg Senior Economist, this book presents a visual distillation of the indicators every investor should follow, with clear explanation of how they're measured, what they mean, and how that should inform investment thinking. The focus on graphics, professional application, Bloomberg terminal functionality, and practicality makes this guide a quick, actionable read that could immediately start improving investment outcomes. Coverage includes gross domestic product, employment data, industrial production, new residential construction, consumer confidence, retail and food service sales, and commodities, plus guidance on the secret indicators few economists know or care about.
Past performance can predict future results – if you know how to read the indicators. Modern investing requires a careful understanding of the macroeconomic forces that lift and topple markets on a regular basis, and how they shift to move entire economies. This book is a visual guide to recognizing these forces and tracking their behavior, helping investors identify entry and exit points that maximize profit and minimize loss.
Quickly evaluate economic trends
Make more informed investment decisions
Understand the most essential indicators
Translate predictions into profitable actions
Savvy market participants know how critical certain indicators are to the formulation of a profitable, effective market strategy. A daily indicator check can inform day-to-day investing, and long-term tracking can result in a stronger, more robust portfolio. For the investor who knows that better information leads to better outcomes, The Economic Indicator Handbook is an exceptionally useful resource.
Trusted by 375,005 students
Access to over 1.5 million titles for a fair monthly price.
Perhaps the best way to appreciate the most important and meaningful economic indicators used by Wall Street economists is to present them in the manner that they are used by those professionals. Every bank, money manager, hedge fund, or financial institution has an interest in economic indicators, and each of those producing the analysis possesses their own individual routine in which they obtain the data, produce a product, and disseminate their respective analysis. For the most part, Wall Street economists use the Bloomberg Professional service for their data, write a daily newsletter—with oftentimes several updates a day—and send it electronically to their clients, investment professionals, and the media.
This chapter attempts to present the most important information used on Wall Street trading desks, and how the desk economist goes about prepping for the day, understanding and appreciating anything that might move the financial markets or alter the outlook for the economy.
The traditional market reaction to news, events, and economic data—particularly the top tier economic indicators—is usually with respect to what insight the news brings to the entire financial market. While some equity analysts use economic releases to determine the trends in some of their respective industries and stocks, most investment professionals look to see how information will influence the broader markets.
For example, should news break about a refinery fire at an integrated oil company, then there may be an immediate negative reaction to that specific company's stock price. Depending on how severe the damage was to its facilities and how long that refinery would be out of commission would dictate the value of the price adjustment. Similarly, if the refinery was large, producing a tremendous amount of gasoline, then the lost supply could disrupt the commodity market, and send prices higher. This wouldn't upset the entire stock, bond, or currency market, with the damage being concentrated in just the trading of some energy products.
When a major economic release hits the newswires, market participants look at the details with respect to how the information contained in the report will influence the prices of a security.
When economic releases are better than expectations, that is, with a positive or bullish implication, equity prices rise and bond prices fall. Yields on bonds (or fixed-income securities) rise since they are inversely related to prices). The economics behind this is that a stronger economic posting like a large number of jobs added in a month, an increase in the orders for durable goods, or an extremely upbeat reading in consumer confidence, implies companies will be conducting a greater amount of business, which is good for revenues and profits.
The reaction to strong economic data in the fixed income market would be very different. Stronger economic conditions possess potentially inflationary conditions. An increase in demand or production is usually accompanied by greater prices. So exceptionally stronger gains in activity are viewed as inflationary, which erodes the value of a fixed income security. The yields on those bonds would rise since they are inversely related.
The opposite holds true for weak economic reports. In the event that one of the manufacturing condition surveys is less than expectations, industrial production contracts, or housing starts fall, stock prices would sour on that news and bond prices would rise (yields would fall).
While each Wall Street economist has varying responsibilities and individual routines, they do share some common traits. Knowing what releases are scheduled for any given day is atop that list. The economic calendar is so important that vacations and time off is planned around economic releases by order of importance. You never call in sick or walk in late for an Employment Situation release, an FOMC meeting, or a day when three or more top-tier indicators are slated for release.
The Economic Calendar
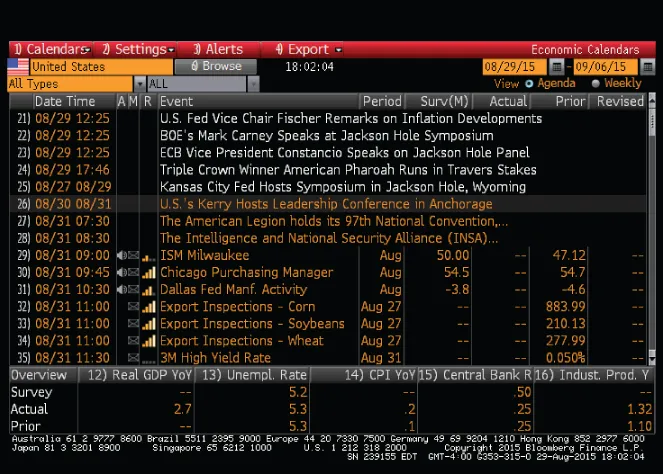
The Bloomberg calendar depicted in Exhibit 1.1 may be obtained by typing ECO <GO> on the Bloomberg Professional terminal. It is the most comprehensive and trusted source for releases in all of finance, detailing the name of the release, date, time, previous value, and the current Street consensus estimate. There's also a relative importance graph identifying how the Street views each index—the larger the number of subscription alerts there are for an individual indicator, the greater the number of bars highlighted in the bar graph located in the “R” column (relative importance) to the left of the Event column. In the associated exhibit, the ISM Milwaukee index clearly is not considered to be as important as the Chicago Purchasing Managers Index.
Exhibit 1.1 The Economic Calendar
Source: Bloomberg
The Bloomberg ECO calendar may be customized to include economic releases like durable goods orders and economic events like speeches by policy makers or Federal Reserve Open Market Committee meeting announcements. The addition of all the government conferences and speeches like those from the secretaries of the Departments of Treasury or State are also available. All Treasury financing auctions are listed as well. Even the commodity reports such as crop conditions or crude oil inventory levels are available. While we are only addressing the U.S. economic indicators, the ECO calendar is available for 189 countries and regions (e.g., Eurozone, G8, G20).
Traders, analysts, and economists always want to know what the market is thinking, so when an economic release hits the tape, they know whether the report is stronger, weaker, or in line with Street expectations.
With respect to the calendar on economic releases, right-clicking on any of the indexes will reveal the detail of all those economists polled and their respective forecast history for that specific indicator (ECOS). The most popular economic releases possess upwards of 100 individual forecasts.
Economist Estimates and Expectations
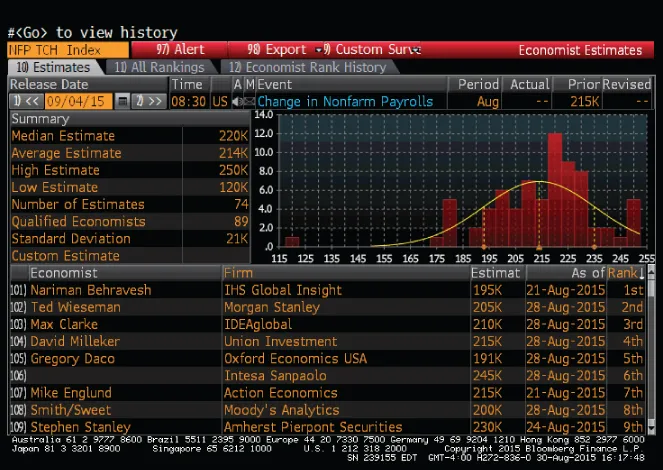
Once in the calendar on economic releases, right-clicking on any of the indexes reveals the Street expectations, as seen in Exhibit 1.2. Here we see the graphical distribution for nonfarm payroll estimates by 74 economists, as well as the average, median, high, low, and standard deviation. There is also a ranking of the economist for that indicator in the lower-right-hand corner, which is based on two years of contributed estimates.
Exhibit 1.2 Economist Estimates
Source: Bloomberg
Then, clicking again on an individual economist or firm reveals a chart of the forecasting history of that particular forecaster for that economic release (Exhibit 1.3), as well as the median and actual number. You can also sele...
Table of contents
Cover
Title Page
Copyright
Table of Contents
Dedication
Acknowledgments
About the Author
Chapter 1: The Daily Blotter
Chapter 2: The Business Cycle
Chapter 3: Gross Domestic Product (GDP)
Chapter 4: The Labor Market and Employment
Chapter 5: Retail Sales
Chapter 6: National Federation of Independent Businesses (NFIB) Small Business Economic Trends
Chapter 7: Personal Income and Outlays
Chapter 8: Housing and Construction
Chapter 9: Manufacturing
Chapter 10: Prices and Inflation
Chapter 11: Confidence and Sentiment
Chapter 12: The Federal Reserve
Sources and Additional Reading
Index
End User License Agreement
Frequently asked questions
Yes, you can cancel anytime from the Subscription tab in your account settings on the Perlego website. Your subscription will stay active until the end of your current billing period. Learn how to cancel your subscription
No, books cannot be downloaded as external files, such as PDFs, for use outside of Perlego. However, you can download books within the Perlego app for offline reading on mobile or tablet. Learn how to download books offline
Perlego offers two plans: Essential and Complete
Essential is ideal for learners and professionals who enjoy exploring a wide range of subjects. Access the Essential Library with 800,000+ trusted titles and best-sellers across business, personal growth, and the humanities. Includes unlimited reading time and Standard Read Aloud voice.
Complete: Perfect for advanced learners and researchers needing full, unrestricted access. Unlock 1.5M+ books across hundreds of subjects, including academic and specialized titles. The Complete Plan also includes advanced features like Premium Read Aloud and Research Assistant.
Both plans are available with monthly, semester, or annual billing cycles.
We are an online textbook subscription service, where you can get access to an entire online library for less than the price of a single book per month. With over 1.5 million books across 990+ topics, we’ve got you covered! Learn about our mission
Look out for the read-aloud symbol on your next book to see if you can listen to it. The read-aloud tool reads text aloud for you, highlighting the text as it is being read. You can pause it, speed it up and slow it down. Learn more about Read Aloud
Yes! You can use the Perlego app on both iOS and Android devices to read anytime, anywhere — even offline. Perfect for commutes or when you’re on the go. Please note we cannot support devices running on iOS 13 and Android 7 or earlier. Learn more about using the app
Yes, you can access The Economic Indicator Handbook by Richard Yamarone in PDF and/or ePUB format, as well as other popular books in Business & Finance. We have over 1.5 million books available in our catalogue for you to explore.