Introduction to Quantitative Data Analysis in the Behavioral and Social Sciences
eBook - ePub

Introduction to Quantitative Data Analysis in the Behavioral and Social Sciences

  1. English
  2. ePUB (mobile friendly)
  3. Available on iOS & Android
eBook - ePub

Introduction to Quantitative Data Analysis in the Behavioral and Social Sciences

Book details
Book preview
Table of contents
Citations

About This Book

Guides readers through the quantitative data analysis process including contextualizing data within a research situation, connecting data to the appropriate statistical tests, and drawing valid conclusions

Introduction to Quantitative Data Analysis in the Behavioral and Social Sciences presents a clear and accessible introduction to the basics of quantitative data analysis and focuses on how to use statistical tests as a key tool for analyzing research data. The book presents the entire data analysis process as a cyclical, multiphase process and addresses the processes of exploratory analysis, decision-making for performing parametric or nonparametric analysis, and practical significance determination. In addition, the author details how data analysis is used to reveal the underlying patterns and relationships between the variables and connects those trends to the data's contextual situation.

Filling the gap in quantitative data analysis literature, this book teaches the methods and thought processes behind data analysis, rather than how to perform the study itself or how to perform individual statistical tests. With a clear and conversational style, readers are provided with a better understanding of the overall structure and methodology behind performing a data analysis as well as the needed techniques to make informed, meaningful decisions during data analysis. The book features numerous data analysis examples in order to emphasize the decision and thought processes that are best followed, and self-contained sections throughout separate the statistical data analysis from the detailed discussion of the concepts allowing readers to reference a specific section of the book for immediate solutions to problems and/or applications. Introduction to Quantitative Data Analysis in the Behavioral and Social Sciences also features coverage of the following:

• The overall methodology and research mind-set for how to approach quantitative data analysis and how to use statistics tests as part of research data analysis

• A comprehensive understanding of the data, its connection to a research situation, and the most appropriate statistical tests for the data

• Numerous data analysis problems and worked-out examples to illustrate the decision and thought processes that reveal underlying patterns and trends

• Detailed examples of the main concepts to aid readers in gaining the needed skills to perform a full analysis of research problems

• A conversational tone to effectively introduce readers to the basics of how to perform data analysis as well as make meaningful decisions during data analysis

Introduction to Quantitative Data Analysis in the Behavioral and Social Sciences is an ideal textbook for upper-undergraduate and graduate-level research method courses in the behavioral and social sciences, statistics, and engineering. This book is also an appropriate reference for practitioners who require a review of quantitative research methods.

Michael J. Albers, Ph.D., is Professor in the Department of English at East Carolina University. His research interests include information design with a focus on answering real-world questions, the presentation of complex information, and human–information interaction. Dr. Albers received his Ph.D. in Technical Communication and Rhetoric from Texas Tech University.

Frequently asked questions

Simply head over to the account section in settings and click on “Cancel Subscription” - it’s as simple as that. After you cancel, your membership will stay active for the remainder of the time you’ve paid for. Learn more here.
At the moment all of our mobile-responsive ePub books are available to download via the app. Most of our PDFs are also available to download and we're working on making the final remaining ones downloadable now. Learn more here.
Both plans give you full access to the library and all of Perlego’s features. The only differences are the price and subscription period: With the annual plan you’ll save around 30% compared to 12 months on the monthly plan.
We are an online textbook subscription service, where you can get access to an entire online library for less than the price of a single book per month. With over 1 million books across 1000+ topics, we’ve got you covered! Learn more here.
Look out for the read-aloud symbol on your next book to see if you can listen to it. The read-aloud tool reads text aloud for you, highlighting the text as it is being read. You can pause it, speed it up and slow it down. Learn more here.
Yes, you can access Introduction to Quantitative Data Analysis in the Behavioral and Social Sciences by Michael J. Albers in PDF and/or ePUB format, as well as other popular books in Matemáticas & Probabilidad y estadística. We have over one million books available in our catalogue for you to explore.

Information

Publisher
Wiley
Year
2017
ISBN
9781119290254

1
Introduction

Basis of How All Quantitative Statistical Based Research
Any research study should have a solid design, properly collected data, and draw its conclusions on effectively analyzed data. All of which are nontrivial problems.
This is a book about performing quantitative data analysis. Unlike most research methods texts, which focus on creating a good design, the focus is on analyzing the data. It is not on how to design the study or collect the data; there many good sources that cover those aspects of research. Of course, poor designs or data collections lead to poor data that means the results of the analysis are useless. Instead, this book focuses on how to analyze the data.
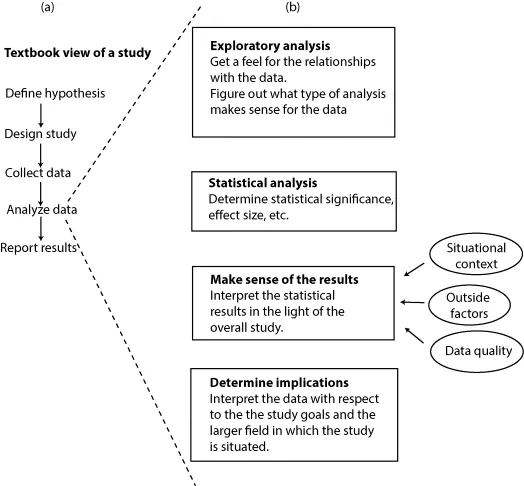
The stereotypical linear view of a research study is shown in Figure 1.1a. Figure 1.1b expands on what is contained within the “analyze data” element. This book only works within that expansion; it focuses on how to analyze data from a study, rather than either how to perform the study or how to perform individual statistical tests.
Figure depicting a view of data analysis as situation within the overall study. (a) Figure depicting the stereotypical linear view of a research study starting from define hypothesis to report results followed by design study, collect data, and analyze data. (b) Figure depicting the expands on what is contained within the “analyze data” element. This includes exploratory analysis, statistical analysis, make sense of the results, and determine implications.
Figure 1.1 View of data analysis as situation within the overall study.
The last two boxes of the expansion in Figure 1.1 “Make sense of the results” and “Determine the implications” are where performing a high-quality data analysis differs from someone simply crunching numbers.
A quantitative study is run to collect data and draw a numerical-based conclusion about that data. A conclusion that must reflect both the numerical analysis and the study context. Thus, data must be analyzed to help draw a study's conclusions. Unfortunately, even great data collected using a great design will be worthless unless the analysis was performed properly. The keyword in the sentence is help versus give the study's conclusions. The results of statistical tests are not the final conclusion for research data analysis. The researcher must study the test results, apply them to the situational context, and then draw conclusions that make sense. To support that process, this book works to place the tests within the context of a problem and provide the background to connect a specific type of data with the appropriate test.
The outcome of any statistical analysis needs to be evaluated in terms of the research context and any conclusions drawn based on that context.
Consider this example of how this book approaches data analysis.
You are interested in which books are being checked out of a library. So, you gather data using many titles that fit within study-defined categories. For example, topical nonfiction or categories for fiction of a particular genre (historical, romance, etc).
At the end of the study's data collection, the analysis looks at the following:
  • Graphs of checkouts by month of the various categories. Do the types of categories vary by day/week through the month? How do the numbers compare? Do the trends of checkouts for each category look the same or different?
  • Run statistics on the daily/month checkouts of the book categories versus demographics of the people who checked them out (age, gender, frequency of library use, etc.). Does age or gender matter for who checks out a romance versus a thriller. From this we can find whether there is a statistically significant difference (e.g., that older readers read more romance than younger readers).

Data Analysis, Not Statistical Analysis

Too many people believe if they can figure out how to run statistical software, then they know how to perform a quantitative data analysis. No! Statistics is only a single tool among many that are required for a data analysis. Likewise, the software is only a tool that provides an easy way to perform a statistical test. Knowing how to perform a t-test or an ANOVA is similar to knowing how to use styles and page layout in Word. Just because you know how to use styles does not make you a writer. It will not make you a good layout person if you do not know when and why to apply those styles. Neither the software nor the specific tests themselves are sufficient; necessary, yes, but sufficient, no! Run the wrong test, and the results are wrong. Fail to think through what the statistical test means to the situation and the overall study fails to have relevance.
It is important to understand that statistics is not data analysis. Learning how to use a software package to perform a t-test is relatively easy and quick. But good data analysis requires knowing when and why to perform a t-test; a much more different, and complex task. Especially for researchers in the social sciences, the goal is not to be a statistical expert, but to know how to analyze data. The goal is to be able to use statistical tests as part of the input required to interpret the study's data and draw valid conclusions from it. There is a wide range of statistical tests relevant to data analysis; some that every researcher should be able to perform and some that require the advice/help of a statistical expert. Good quantitative data analysis does not require a comprehensive knowledge of statistics, but, rather, knowing enough to know when it is time to ask for help and what questions to ask. Many times throughout the book, the comment to consult a statistician appears.
Figure 1.1 shows data analysis as one of five parts of a study; a part that deserves and often requires 20% of the full study's time. I recently had to review a set of undergraduate honors research project proposals; they consistently had several weeks scheduled for data collection, a couple of weeks for data clean up, and data analysis was done on Tuesday's. This type of time allocation is not uncommon for young researchers, probably based on a view that the analysis is just running a few t-tests and/or ANOVAs on the data and copying the test output into the study report. Unfortunately, with that sort of analysis, the researchers will never reach more than a superficial level of understanding of the data or be able to draw more than superficial conclusions from it.
The purpose of a quantitative research study is to gain an understanding of the research situation. Thus, the data analysis is the study; the study results come directly out of the analysis. It is not the collection and not the reporting; without the data analysis there is no reason to collect data and there is nothing of value to report.

Use Dedicated Statistical Software

There are many dedicated statistical software programs (JMP, SPSS, R, Minitab) and many others. When you are doing data analysis, it is important to take the time to learn how to use one of these packages. All of them can perform all the standard statistical tests and the nonstandard tests, while important in their niche ...

Table of contents

  1. Cover
  2. Title Page
  3. Copyright
  4. Preface
  5. About the Companion Website
  6. Chapter 1: Introduction
  7. Part I: Data Analysis Approaches
  8. Part II: Data Analysis Examples
  9. Appendix A: Research Terminology
  10. Index
  11. End User License Agreement