Introduction to Bayesian Statistics
eBook - ePub

Introduction to Bayesian Statistics

  1. English
  2. ePUB (mobile friendly)
  3. Available on iOS & Android
eBook - ePub

Introduction to Bayesian Statistics

Book details
Book preview
Table of contents
Citations

About This Book

"...this edition is useful and effective in teaching Bayesian inference at both elementary and intermediate levels. It is a well-written book on elementary Bayesian inference, and the material is easily accessible. It is both concise and timely, and provides a good collection of overviews and reviews of important tools used in Bayesian statistical methods."

There is a strong upsurge in the use of Bayesian methods in applied statistical analysis, yet most introductory statistics texts only present frequentist methods. Bayesian statistics has many important advantages that students should learn about if they are going into fields where statistics will be used. In this third Edition, four newly-added chapters address topics that reflect the rapid advances in the field of Bayesian statistics. The authors continue to provide a Bayesian treatment of introductory statistical topics, such as scientific data gathering, discrete random variables, robust Bayesian methods, and Bayesian approaches to inference for discrete random variables, binomial proportions, Poisson, and normal means, and simple linear regression. In addition, more advanced topics in the field are presented in four new chapters: Bayesian inference for a normal with unknown mean and variance; Bayesian inference for a Multivariate Normal mean vector; Bayesian inference for the Multiple Linear Regression Model; and Computational Bayesian Statistics including Markov Chain Monte Carlo. The inclusion of these topics will facilitate readers' ability to advance from a minimal understanding of Statistics to the ability to tackle topics in more applied, advanced level books. Minitab macros and R functions are available on the book's related website to assist with chapter exercises. Introduction to Bayesian Statistics, Third Edition also features:

  • Topics including the Joint Likelihood function and inference using independent Jeffreys priors and join conjugate prior
  • The cutting-edge topic of computational Bayesian Statistics in a new chapter, with a unique focus on Markov Chain Monte Carlo methods
  • Exercises throughout the book that have been updated to reflect new applications and the latest software applications
  • Detailed appendices that guide readers through the use of R and Minitab software for Bayesian analysis and Monte Carlo simulations, with all related macros available on the book's website

Introduction to Bayesian Statistics, Third Edition is a textbook for upper-undergraduate or first-year graduate level courses on introductory statistics course with a Bayesian emphasis. It can also be used as a reference work for statisticians who require a working knowledge of Bayesian statistics.

Frequently asked questions

Simply head over to the account section in settings and click on ā€œCancel Subscriptionā€ - itā€™s as simple as that. After you cancel, your membership will stay active for the remainder of the time youā€™ve paid for. Learn more here.
At the moment all of our mobile-responsive ePub books are available to download via the app. Most of our PDFs are also available to download and we're working on making the final remaining ones downloadable now. Learn more here.
Both plans give you full access to the library and all of Perlegoā€™s features. The only differences are the price and subscription period: With the annual plan youā€™ll save around 30% compared to 12 months on the monthly plan.
We are an online textbook subscription service, where you can get access to an entire online library for less than the price of a single book per month. With over 1 million books across 1000+ topics, weā€™ve got you covered! Learn more here.
Look out for the read-aloud symbol on your next book to see if you can listen to it. The read-aloud tool reads text aloud for you, highlighting the text as it is being read. You can pause it, speed it up and slow it down. Learn more here.
Yes, you can access Introduction to Bayesian Statistics by William M. Bolstad, James M. Curran in PDF and/or ePUB format, as well as other popular books in Mathematics & Probability & Statistics. We have over one million books available in our catalogue for you to explore.

Information

Publisher
Wiley
Year
2016
ISBN
9781118593226
Edition
3

CHAPTER 1
INTRODUCTION TO STATISTICAL SCIENCE

Statistics is the science that relates data to specific questions of interest. This includes devising methods to gather data relevant to the question, methods to summarize and display the data to shed light on the question, and methods that enable us to draw answers to the question that are supported by the data. Data almost always contain uncertainty. This uncertainty may arise from selection of the items to be measured, or it may arise from variability of the measurement process. Drawing general conclusions from data is the basis for increasing knowledge about the world, and is the basis for all rational scientific inquiry. Statistical inference gives us methods and tools for doing this despite the uncertainty in the data. The methods used for analysis depend on the way the data were gathered. It is vitally important that there is a probability model explaining how the uncertainty gets into the data.

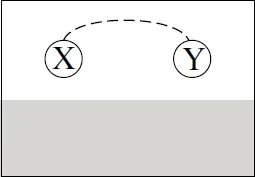
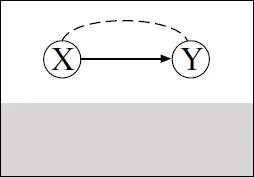
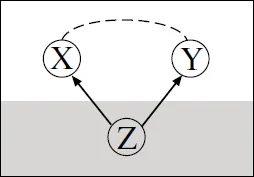
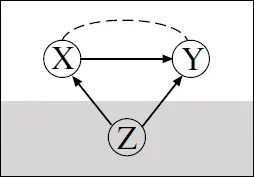
Showing a Causal Relationship from Data

Suppose we have observed two variables X and Y. Variable X appears to have an association with variable Y. If high values of X occur with high values of variable Y and low values of X occur with low values of Y, then we say the association is positive. On the other hand, the association could be negative in which high values of variable X occur in with low values of variable Y. Figure 1.1 shows a schematic diagram where the association is indicated by the dashed curve connecting X and Y. The unshaded area indicates that X and Y are observed variables. The shaded area indicates that there may be additional variables that have not been observed.
Image described by surrounding text and caption.
Figure 1.1 Association between two variables.
Diagram shows variables in the unshaded area X and Y connected by a dashed curve and an arrow from X to Y depicting the causal relationship.
Figure 1.2 Association due to causal relationship.
We would like to determine why the two variables are associated. There are several possible explanations. The association might be a causal one. For example, X might be the cause of Y. This is shown in Figure 1.2, where the causal relationship is indicated by the arrow from X to Y.
On the other hand, there could be an unidentified third variable Z that has a causal effect on both X and Y. They are not related in a direct causal relationship. The association between them is due to the effect of Z. Z is called a lurking variable, since it is hiding in the background and it affects the data. This is shown in Figure 1.3.
Diagram shows variables in the unshaded area X and Y connected by a dashed curve and arrows from lurking variable Z in the shaded region to X and Y.
Figure 1.3 Association due to lurking variable.
Diagram shows variables in the unshaded area X and Y connected by a dashed curve, an arrow from X to Y and arrows from lurking variable Z in the shaded region to X and Y.
Figure 1.4 Confounded causal and lurking variable effects.
It is possible that both a causal effect and a lurking variable may both be contributing to the association. This is shown in Figure 1.4. We say that the causal effect and the effect of the lurking variable are confounded. This means that both effects are included in the association.
Our first goal is to determine which of the possible reasons for the association holds. If we conclude that it is due to a causal effect, then our next goal is to determine the size of the effect. If we conclude that the association is due to causal effect confounded with the effect of a lurking variable, then our next goal becomes determining the sizes of both the effects.

1.1 The Scientific Method: A Process for Learning

In the Middle Ages, science was deduced from principles set down many centuries earlier by authorities such as Aristotle. The idea that scientific theories should be tested against real world data revolutionized thinking. This way of thinking known as the scientific method sparked the Renaissance.
The scientific method rests on the following premises:
  1. A scientific hypothesis can never be shown to be absolutely true.
  2. However, it must potentially be disprovable.
  3. It is a useful model until it is established that it is not true.
  4. Always go for the simplest hypothesis, unless it can be shown to be false.
This last principle, elaborated by William of Ockham in the 13th century, is now known as Ockhamā€™s razor and is firmly embedded in science. It keeps science from developing fanciful overly elaborate theories. Thus the scientific method directs us through an improving sequence of models, as previous ones get falsified. The scientific method generally follows the following procedure:
  1. Ask a question or pose a problem in terms of the current scientific hypothesis.
  2. Gather all the relevant information that is currently available. This includes the current knowledge about parameters of the model.
  3. Design an investigation or experiment that addresses the question from step 1. The predicted outcome of the experiment should be one thing if the current hypothesis is true, and something else if the hypothesis is false.
  4. Gather data from the experiment.
  5. Draw conclusions given the experimental results. Revise the knowledge about the parameters to take the current results into account.
The scientific method searches for cause-and-effect relationships between an experimental variable and an outcome variable. In other words, how changing the experimental variable results in a change to the outcome variable. Scientific modeling develops mathematical models of these relationships. Both of them need to isolate the experiment from outside factors that could affect the experimental results. All outside factors that can be identified as possibly affecting the results must be controlled. It is no coincidence that the earliest successes for the method were in physics and chemistry where the few outside factors could be identified and controlled. Thus there were no lurking variables. All other relevant variables could be identified and could then be physically controlled by being held constant. That way they would not affect results of the experiment, and the effect of the experimental variable on the outcome variable could be determined. In biology, medicine, engineering, technology, and the social sciences it is not that easy to identify the relevant factors that must be controlled. In those fields a different way to control outside factors is needed, because they cannot be identified beforehand and physically controlled.

1.2 The Role of Statistics in the Scientific Method

Statistical methods of inference can be used when there is random variability in the data. The probability model for the data is justified by the design of the investigation or experiment. This can extend the scientific method into situations where the relevant outside factors cannot even be identified. Since we cannot identify these outside factors, we cannot control them directly. The lack of direct control means the outside factors will be affecting the data. There is a danger that the wrong conclusions could be drawn from the experiment due to these uncontrolled outside factors.
The important statistical idea of randomization has been developed to deal with this possibility. The unidentified outside factors can be ā€œaveraged outā€ by randomly assigning each unit to either treatment or control group. This contributes variability to the data. Statistical conclusions always have some uncertainty or error due to variability in the data. We can develop a probability model of the data variability based on the randomization used. Randomization not only reduces this uncertainty due to outside factors, it also allows us to measure the amount of uncertainty that remains using the probability model. Randomization lets us control the outside factors statistically, by averaging out their effects.
Underlying this is the idea of a statistical population, consisting of all possible values of the observations that could be made. The data consists of observations taken from a sample of the population. For valid inferences about the population parameters from the sample statistics, the sample must be ā€œrepresentativeā€ of the population. Amazingly, choosing the sample randomly is the most effective way to get representative samples!

1.3 Main Approaches to Statistics

There are two main philosophical approaches to statistics. The first is often referred to as the frequentist approach. Sometimes it is called the classical approach. Procedures are developed by looking at how they perform over all possible random samples. The probabilities do not relate to the particular random sample that was obtained. In many ways this indirect method places the ā€œcart before the horse.ā€
The alternative approach that we take in this book is the Bayesian approach. It applies the laws of probability directly to the problem. This offers many fundamental advantages over...

Table of contents

  1. Cover
  2. TitlePage
  3. Copyright
  4. Dedication
  5. Preface
  6. Chapter 1 Introduction to Statistical Science
  7. Chapter 2 Scientific Data Gathering
  8. Chapter 3 Displaying and Summarizing Data
  9. Chapter 4 Logic, Probability, and Uncertainty
  10. Chapter 5 Discrete Random Variables
  11. Chapter 6 Bayesian Inference for Discrete Random Variables
  12. Chapter 7 Continuous Random Variables
  13. Chapter 8 Bayesian Inference for Binomial Proportion
  14. Chapter 9 Comparing Bayesian and Frequentist Inferences for Proportion
  15. Chapter 10 Bayesian Inference for Poisson
  16. Chapter 11 Bayesian Inference for Normal Mean
  17. Chapter 12 Comparing Bayesian and Frequentist Inferences for Mean
  18. Chapter 13 Bayesian Inference for Difference Between Means
  19. Chapter 14 Bayesian Inference for Simple Linear Regression
  20. Chapter 15 Bayesian Inference for Standard Deviation
  21. Chapter 16 Robust Bayesian Methods
  22. Chapter 17 Bayesian Inference for Normal with Unknown Mean and Variance
  23. Chapter 18 Bayesian Inference for Multivariate Normal Mean Vector
  24. Chapter 19 Bayesian Inference for the Multiple Linear Regression Model
  25. Chapter 20 Computational Bayesian Statistics Including Markov Chain Monte Carlo
  26. A Introduction to Calculus
  27. B Use of Statistical Tables
  28. C Using the Included Minitab Macros
  29. D Using the Included R Functions
  30. E Answers to Selected Exercises
  31. References
  32. Index
  33. EULA