An Introduction to Statistical Analysis in Research
eBook - ePub

An Introduction to Statistical Analysis in Research

With Applications in the Biological and Life Sciences

  1. English
  2. ePUB (mobile friendly)
  3. Available on iOS & Android
eBook - ePub

An Introduction to Statistical Analysis in Research

With Applications in the Biological and Life Sciences

Book details
Book preview
Table of contents
Citations

About This Book

Provides well-organized coverage of statistical analysis and applications in biology, kinesiology, and physical anthropology with comprehensive insights into the techniques and interpretations of R, SPSS®, Excel®, and Numbers® output

An Introduction to Statistical Analysis in Research: With Applications in the Biological and Life Sciences develops a conceptual foundation in statistical analysis while providing readers with opportunities to practice these skills via research-based data sets in biology, kinesiology, and physical anthropology. Readers are provided with a detailed introduction and orientation to statistical analysis as well as practical examples to ensure a thorough understanding of the concepts and methodology. In addition, the book addresses not just the statistical concepts researchers should be familiar with, but also demonstrates their relevance to real-world research questions and how to perform them using easily available software packages including R, SPSS®, Excel®, and Numbers®. Specific emphasis is on the practical application of statistics in the biological and life sciences, while enhancing reader skills in identifying the research questions and testable hypotheses, determining the appropriate experimental methodology and statistical analyses, processing data, and reporting the research outcomes.

In addition, this book:

• Aims to develop readers' skills including how to report research outcomes, determine the appropriate experimental methodology and statistical analysis, and identify the needed research questions and testable hypotheses

• Includes pedagogical elements throughout that enhance the overall learning experience including case studies and tutorials, all in an effort to gain full comprehension of designing an experiment, considering biases and uncontrolled variables, analyzing data, and applying the appropriate statistical application with valid justification

• Fills the gap between theoretically driven, mathematically heavy texts and introductory, step-by-step type books while preparing readers with the programming skills needed to carry out basic statistical tests, build support figures, and interpret the results

• Provides a companion website that features related R, SPSS, Excel, and Numbers data sets, sample PowerPoint® lecture slides, end of the chapter review questions, software video tutorials that highlight basic statistical concepts, and a student workbook and instructor manual

An Introduction to Statistical Analysis in Research: With Applications in the Biological and Life Sciences is an ideal textbook for upper-undergraduate and graduate-level courses in research methods, biostatistics, statistics, biology, kinesiology, sports science and medicine, health and physical education, medicine, and nutrition. The book is also appropriate as a reference for researchers and professionals in the fields of anthropology, sports research, sports science, and physical education.

KATHLEEN F. WEAVER, PhD, is Associate Dean of Learning, Innovation, and Teaching and Professor in the Department of Biology at the University of La Verne. The author of numerous journal articles, she received her PhD in Ecology and Evolutionary Biology from the University of Colorado.

VANESSA C. MORALES, BS, is Assistant Director of the Academic Success Center at the University of La Verne.

SARAH L. DUNN, PhD, is Associate Professor in the Department of Kinesiology at the University of La Verne and is Director of Research and Sponsored Programs. She has authored numerous journal articles and received her PhD in Health and Exercise Science from the University of New South Wales.

KANYA GODDE, PhD, is Assistant Professor in the Department of Anthropology and is Director/Chair of Institutional Review Board at the University of La Verne. The author of numerous journal articles and a member of the American Statistical Association, she received her PhD in Anthropology from the University of Tennessee.

PABLO F. WEAVER, PhD, is Instructor in the Department of Biology at the University of La Verne. The author of numerous journal articles, he received his PhD in Ecology and Evolutionary Biology from the University of Colorado.

Frequently asked questions

Simply head over to the account section in settings and click on “Cancel Subscription” - it’s as simple as that. After you cancel, your membership will stay active for the remainder of the time you’ve paid for. Learn more here.
At the moment all of our mobile-responsive ePub books are available to download via the app. Most of our PDFs are also available to download and we're working on making the final remaining ones downloadable now. Learn more here.
Both plans give you full access to the library and all of Perlego’s features. The only differences are the price and subscription period: With the annual plan you’ll save around 30% compared to 12 months on the monthly plan.
We are an online textbook subscription service, where you can get access to an entire online library for less than the price of a single book per month. With over 1 million books across 1000+ topics, we’ve got you covered! Learn more here.
Look out for the read-aloud symbol on your next book to see if you can listen to it. The read-aloud tool reads text aloud for you, highlighting the text as it is being read. You can pause it, speed it up and slow it down. Learn more here.
Yes, you can access An Introduction to Statistical Analysis in Research by Kathleen F. Weaver, Vanessa C. Morales, Sarah L. Dunn, Kanya Godde, Pablo F. Weaver in PDF and/or ePUB format, as well as other popular books in Mathématiques & Probabilités et statistiques. We have over one million books available in our catalogue for you to explore.

Information

Publisher
Wiley
Year
2017
ISBN
9781119301103

1
Experimental Design

Learning Outcomes

By the end of this chapter, you should be able to:
  1. Define key terms related to sampling and variables.
  2. Describe the relationship between a population and a sample in making a statistical estimate.
  3. Determine the independent and dependent variables within a given scenario.
  4. Formulate a study with an appropriate sampling design that limits bias and error.

1.1 Experimental Design Background

As scientists, our knowledge of the natural world comes from direct observations and experiments. A good experimental design is essential for making inferences and drawing appropriate conclusions from our observations. Experimental design starts by formulating an appropriate question and then knowing how data can be collected and analyzed to help answer your question. Let us take the following example.

Case Study

Observation: A healthy body weight is correlated with good diet and regular physical activity. One component of a good diet is consuming enough fiber; therefore, one question we might ask is: do Americans who eat more fiber on a daily basis have a healthier body weight or body mass index (BMI) score?
How would we go about answering this question?
In order to get the most accurate data possible, we would need to design an experiment that would allow us to survey the entire population (all possible test subjects – all people living in the United States) regarding their eating habits and then match those to their BMI scores. However, it would take a lot of time and money to survey every person in the country. In addition, if too much time elapses from the beginning to the end of collection, then the accuracy of the data would be compromised.
More practically, we would choose a representative sample with which to make our inferences. For example, we might survey 5000 men and 5000 women to serve as a representative sample. We could then use that smaller sample as an estimate of our population to evaluate our question. In order to get a proper (and unbiased) sample and estimate of the population, the researcher must decide on the best (and most effective) sampling design for a given question.

1.2 Sampling Design

Below are some examples of sampling strategies that a researcher could use in setting up a research study. The strategy you choose will be dependent on your research question. Also keep in mind that the sample size (N) needed for a given study varies by discipline. Check with your mentor and look at the literature to verify appropriate sampling in your field.
Some of the sampling strategies introduce bias. Bias occurs when certain individuals are more likely to be selected than others in a sample. A biased sample can change the predictive accuracy of your sample; however, sometimes bias is acceptable and expected as long as it is identified and justifiable. Make sure that your question matches and acknowledges the inherent bias of your design.

Random Sample

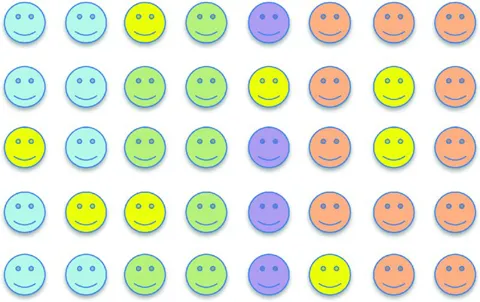
In a random sample all individuals within a population have an equal chance of being selected, and the choice of one individual does not influence the choice of any other individual (as illustrated in Figure 1.1). A random sample is assumed to be the best technique for obtaining an accurate representation of a population. This technique is often associated with a random number generator, where each individual is assigned a number and then selected randomly until a preselected sample size is reached. A random sample is preferred in most situations, unless there are limitations to data collection or there is a preference by the researcher to look specifically at subpopulations within the larger population.
Diagram shows 8 columns and 5 rows of smiley faces where few of them are colored.
Figure 1.1 A representation of a random sample of individuals within a population.
In our BMI example, a person in Chicago and a person in Seattle would have an equal chance of being selected for the study. Likewise, selecting someone in Seattle does not eliminate the possibility of selecting other participants from Seattle. As easy as this seems in theory, it can be challenging to put into practice.

Systematic Sample

A systematic sample is similar to a random sample. In this case, potential participants are ordered (e.g., alphabetically), a random first individual is selected, and every kth individual afterward is picked for inclusion in the sample. It is best practice to randomly choose the first participant and not to simply choose the first person on the list. A random number generator is an effective tool for this. To determine k, divide the number of individuals within a population by the desired sample size.
This technique is often used within institutions or companies where there are a larger number of potential participants and a subset is desired. In Figure 1.2, the third person (going down the first column) is the first individual selected and every sixth person afterward is selected for a total of 7 out of 40 possible.
Diagram shows 8 columns and 5 rows of smiley faces where few of them are colored.
Figure 1.2 A systematic sample of individuals within a population, starting at the third individual and then selecting every sixth subsequent individual in the group.

Stratified Sample

A stratified sample is necessary if your population includes a number of different categories and you want to make sure your sample includes all categories (e.g., gender, ethnicity, other categorical variables). In Figure 1.3, the population is organized first by category (i.e., strata) and then random individuals are selected from each category.
Diagram shows 8 columns and 5 rows of smiley faces where most of them are colored.
Figure 1.3 A stratified sample of individuals within a population. A minimum of 20% of the individuals within each subpopulation were selected.
In our BMI example, we might want to make sure all regions of the country are represented in the sample. For example, you might want to randomly choose at least one person from each city represented in your population (e.g., Seattle, Chicago, New York, etc.).

Volunteer Sample

A volunteer sample is used when participants volunteer for a particular study. Bias would be assumed for a volunteer sample because people who are likely to volunteer typically have certain characteristics in common. Like all other sample types, collecting demographic data would be important for a volunteer study, so that you can determine most of the potential biases in your data.

Sample of Convenience

A sample of convenience is not representative of a target population because it gives preference to individuals within close proximity. The reality is that samples are often chosen based on the availability of a sample to the researcher.
Here are some examples:
  • A university researcher interested in studying BMI versus fiber intake might choose to sample from the students or faculty she has direct access to...

Table of contents

  1. Cover
  2. Title Page
  3. Copyright
  4. Preface
  5. Acknowledgments
  6. About the Companion Website
  7. 1: Experimental Design
  8. 2: Central Tendency and Distribution
  9. 3: Showing Your Data
  10. 4: Parametric versus Nonparametric Tests
  11. 5: t-Test
  12. 6: ANOVA
  13. 7: Mann–Whitney U and Wilcoxon Signed-Rank
  14. 8: Kruskal–Wallis
  15. 9: Chi-Square Test
  16. 10: Pearson's and Spearman's Correlation
  17. 11: Linear Regression
  18. 12: Basics in Excel
  19. 13: Basics in SPSS
  20. 14: Basics in Numbers
  21. 15: Basics in R
  22. 16: Appendix
  23. Literature Cited
  24. Glossary
  25. Index
  26. EULA