- English
- ePUB (mobile friendly)
- Available on iOS & Android
Basic Data Analysis for Time Series with R
About this book
Presents modern methods to analyzing data with multiple applications in a variety of scientific fields
Written at a readily accessible level, Basic Data Analysis for Time Series with R emphasizes the mathematical importance of collaborative analysis of data used to collect increments of time or space. Balancing a theoretical and practical approach to analyzing data within the context of serial correlation, the book presents a coherent and systematic regression-based approach to model selection. The book illustrates these principles of model selection and model building through the use of information criteria, cross validation, hypothesis tests, and confidence intervals.
Focusing on frequency- and time-domain and trigonometric regression as the primary themes, the book also includes modern topical coverage on Fourier series and Akaike's Information Criterion (AIC). In addition, Basic Data Analysis for Time Series with R also features:
- Real-world examples to provide readers with practical hands-on experience
- Multiple R software subroutines employed with graphical displays
- Numerous exercise sets intended to support readers understanding of the core concepts
- Specific chapters devoted to the analysis of the Wolf sunspot number data and the Vostok ice core data sets
Tools to learn more effectively

Saving Books

Keyword Search

Annotating Text

Listen to it instead
Information
PART I
BASIC CORRELATION STRUCTURES
1
R BASICS
1.1 GETTING STARTED
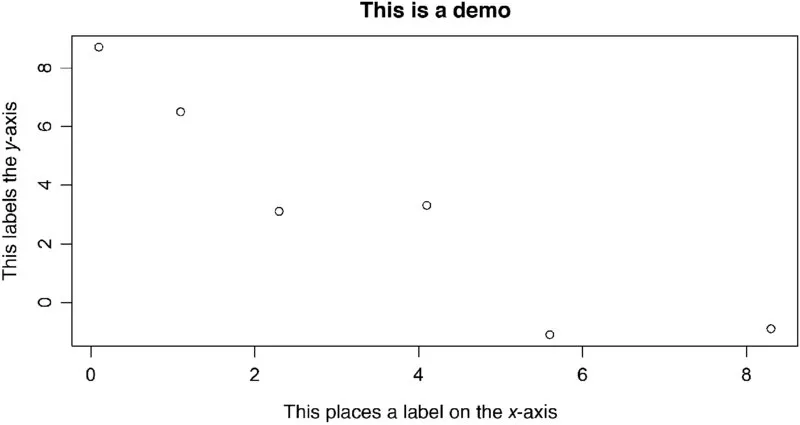
# this is a comment x <- c(0.1,1.1,2.3,4.1, 5.6, 8.3) # create a vector of 6 values, these were just made up y <- c(8.7, 6.5, 3.1, 3.3, −1.1, −0.9) #create a second vector plot(x,y,xlab = “this places a label on the x axis”, ylab = “this labels the y axis”) title(“this is a demo”) # either “<-” or “=” can be used for assignments, but “<-” makes more sense. # The reader should be aware that “=” and “<-” are not always interchangeable in R | n | is always the sample size. |
| y | variants represent response variables. |
| noise | simulated white noise (independent normal random variables). |
| error | random error added to models (may not be white noise). |
| x | variants are independent/explanatory variables. |
| i | the square root of −1, in other words, we will not use this for any other purpose in this book. We will not use it as a variable or name. |
| time | usually integers from 1 to n, representing equally spaced time intervals. |
- mean(x) produces the output: 3.583333 which is the mean of the x values.
- sum(x) produces the o...
Table of contents
- Cover
- Titlepage
- Copyright
- PREFACE
- ACKNOWLEDGMENTS
- PART I BASIC CORRELATION STRUCTURES
- PART II ANALYSIS OF PERIODIC DATA AND MODEL SELECTION
- PART III COMPLEX TEMPORAL STRUCTURES
- PART IV SOME DETAILED AND COMPLETE EXAMPLES
- Appendix A Using Datamarket
- Appendix B AIC is PRESS!
- Appendix C A 15-Minute Tutorial on Nonlinear Optimization
- REFERENCES
- INDEX
- End User License Agreement
Frequently asked questions
- Essential is ideal for learners and professionals who enjoy exploring a wide range of subjects. Access the Essential Library with 800,000+ trusted titles and best-sellers across business, personal growth, and the humanities. Includes unlimited reading time and Standard Read Aloud voice.
- Complete: Perfect for advanced learners and researchers needing full, unrestricted access. Unlock 1.4M+ books across hundreds of subjects, including academic and specialized titles. The Complete Plan also includes advanced features like Premium Read Aloud and Research Assistant.
Please note we cannot support devices running on iOS 13 and Android 7 or earlier. Learn more about using the app