![]()
CHAPTER 1
How to search for evidence
1.1 Obstacles to searching for evidence
Clinicians who do not search the literature for evidence quote lack of time1-5 and lack of knowledge as the main constraints.6,7
In this brief chapter, we will suggest a rapid and easy approach to searching for evidence. For more detail, one journal publication8 and three books9-11 can be consulted.
1.2 Sources of evidence
1.2.1 The Cochrane library
The Cochrane Collaboration was established in 1993 and named for the British epidemiologist Archie Cochrane. It is an international non-profit making organization which publishes online evidence about health care in the Cochrane Library including almost 5000 systematic Cochrane Reviews. Cochrane Reviews of treatment interventions are usually restricted to randomized controlled trials (RCTs) because this is the best study design to avoid bias. The Cochrane Library is free in developing countries, in the United Kingdom (where the NHS pays for it) and in Australia (paid for by the Federal Government). In the United States, access requires a subscription, but many libraries and hospitals subscribe so that it is readily available to many clinicians. The Cochrane Library website is http://www.thecochranelibrary.com/.
For the evidence for an intervention, search the Cochrane Library (Figure 1.1) first by typing your topic into the box marked SEARCH THE COCHRANE LIBRARY and clicking on Go. Try different search terms because they will give different information.
1.2.2 Medline and PubMed
PubMed is provided free by the US National Library of Medicine and the National Institutes of Health and gives access to the comprehensive database Medline to anyone with internet access. The website is http://www.pubmed.gov/.
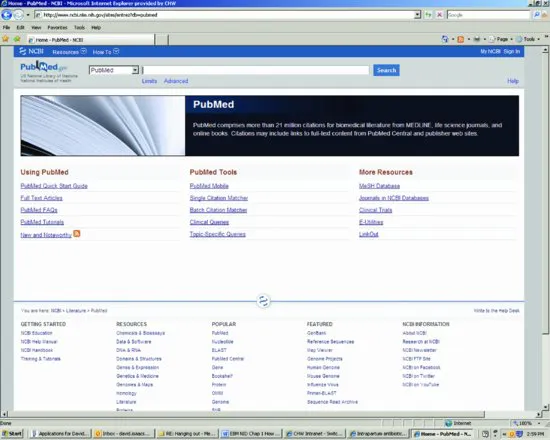
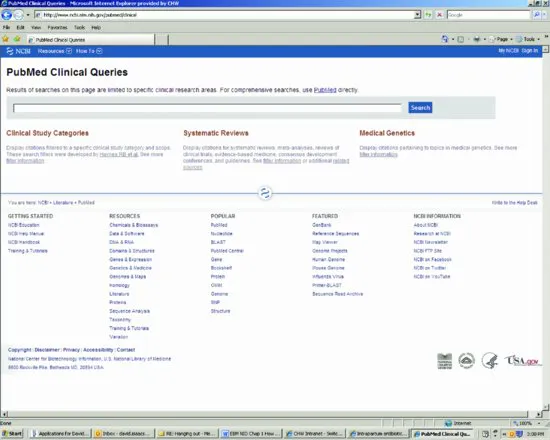
The best approach to find evidence is to use the Clinical Queries option in PubMed. Click on Clinical Queries, under PubMed Tools, currently in the centre of the PubMed home page (Figure 1.2), which brings up a new screen (Figure 1.3). Enter your search terms into the Search box and click on SEARCH. PubMed automatically finds RCTs in the first column (set the Category to “therapy” and Scope to “narrow” to find RCTs) and systematic reviews including Cochrane reviews in the middle column (Figure 1.3). Ignore the third column (only used by geneticists). Experiment with search terms until you find the best ways of expanding or narrowing the search to find what you want.
1.3 Statistical terms and explanations
Cluster randomized trial: a trial in which a group of individuals is randomized. For example, whole villages could be randomized to have a study intervention or no intervention, rather than individuals. The village becomes the unit of randomization. Outcomes are compared between those who do and do not receive the intervention.
Confidence Intervals (CI): a way of quantifying measurement uncertainty. This is usually expressed as the 95% CI, which means that the true value will be within the range 95% of the time. If the Relative Risk of dying with treatment compared with placebo is 0.50 (95% CI 0.20–0.75), the treatment reduces the risk of dying by 50%, and 95% of the time it will reduce the risk by somewhere between 20% and 75%.
Negative predictive value (NPV): the proportion of subjects with a negative test result who are correctly diagnosed. The negative predictive value of a test for sepsis is a reflection of the test sensitivity and the incidence of sepsis in the population. The higher the negative predictive value of a test, the safer it is to use a negative test result as a basis to withhold treatment. If a test for sepsis has an NPV of 100%, then no child with sepsis will have a false negative result and all septic children will be identified by the test.
Number Needed to Treat (NNT): the number of patients you need to treat in order to achieve one extra favourable outcome. For example, if 19 of 20 patients treated with antibiotics for an infection get better compared with 14 of 20 treated with placebo, five extra patients get better for every 20 treated so the NNT is 20/5 or 4.
Odds Ratio (OR): the ratio of the odds of having the outcome in the treated group compared to the odds of having it in the control group. For example:
- If 100 of 1000 treated patients have persistent symptoms, the odds of persistent symptoms are 100/900 or 0.11 (11%).
- If 300 of 1000 untreated/placebo patients in the same study have persistent symptoms, the odds are 300/700 or 0.43 (43%).
- The odds ratio (OR) is 0.11/0.43 which is 0.26.
Positive predictive value (PPV): the proportion of subjects with a positive test result who are correctly diagnosed. The positive predictive value of a test for sepsis is a reflection of the test specificity and the incidence of sepsis in the population. If all infants with a positive test result receive antibiotics, for example, the higher the positive predictive value of a test for sepsis, the fewer children without sepsis will receive antibiotics.
Relative Risk or Risk Ratio (RR): the ratio of the risk in the treated group to the risk in the control group. For example:
- If 100 of 1000 treated patients have persistent symptoms, the risk of persistent symptoms is 100/1000 or 0.1 (10%).
- If 300 of 1000 untreated/placebo patients in the same study have persistent symptoms, the risk is 300/1000 or 0.3 (30%).
- The Relative Risk or Risk Ratio is 0.1/0.3 which is 0.33.
[When the event rate is 10% or lower, the OR and RR are similar. For more common events, the difference between OR and RR becomes wider, with the RR always closer to one. In general, it is preferable to use RR.11]
Sensitivity: the sensitivity of a test is the proportion of true positives correctly identified by the test (e.g. the percentage of infected infants who are correctly identified as having infection).
Specificity: the specificity of a test is the proportion of negatives correctly identified by the test (e.g. the percentage of healthy infants who are correctly identified by a sepsis test as not having infection).
1.4 Useful websites
The Cochrane Library: www.thecochranelibrary.com
Clinical Evidence: www.clinicalevidence.com
MEDLINE via PubMed: www.pubmed.gov
GRADE working group: www.gradeworkinggroup.org
[N.B. This chapter is adapted from Chapter 1 of reference 10 and we acknowledge some repetition.]
References
1. Dawes M, Sampson U. Knowledge management in clinical practice: a systematic review of information seeking behavior in physicians. Int J Med Inf 2003; 71:91–95.
2. Riordan FAI, Boyle EM, Phillips B. Best paediatric evidence; is it accessible and used on-call?. Arch Dis Child 2004; 89:469–471.
3. D'Alessandro DM, Kreiter CD, Peterson MW. An evaluation of ...