eBook - ePub
Atlas of Small Animal Ultrasonography
This is a test
- English
- ePUB (mobile friendly)
- Available on iOS & Android
eBook - ePub
Atlas of Small Animal Ultrasonography
Book details
Book preview
Table of contents
Citations
About This Book
Atlas of Small Animal Ultrasonography, Second Edition is a comprehensive reference for ultrasound techniques and findings in small animal practice, with more than 2000 high-quality sonograms and illustrations of normal structures and disorders.
- Provides a comprehensive collection of more than 2000 high-quality images, including both normal and abnormal ultrasound features, as well as relevant complementary imaging modalities and histopathological images
- Covers both common and uncommon disorders in small animal patients
- Offers new chapters on practical physical concepts and artifacts and abdominal contrast sonography
- Includes access to a companion website with over 140 annotated video loops of the most important pathologies covered in each section of the book
Frequently asked questions
At the moment all of our mobile-responsive ePub books are available to download via the app. Most of our PDFs are also available to download and we're working on making the final remaining ones downloadable now. Learn more here.
Both plans give you full access to the library and all of Perlego’s features. The only differences are the price and subscription period: With the annual plan you’ll save around 30% compared to 12 months on the monthly plan.
We are an online textbook subscription service, where you can get access to an entire online library for less than the price of a single book per month. With over 1 million books across 1000+ topics, we’ve got you covered! Learn more here.
Look out for the read-aloud symbol on your next book to see if you can listen to it. The read-aloud tool reads text aloud for you, highlighting the text as it is being read. You can pause it, speed it up and slow it down. Learn more here.
Yes, you can access Atlas of Small Animal Ultrasonography by Dominique Penninck, Marc-André d'Anjou, Dominique Penninck, Marc-André d'Anjou in PDF and/or ePUB format, as well as other popular books in Medizin & Veterinärmedizin. We have over one million books available in our catalogue for you to explore.
Information
CHAPTER ONE
Practical Physical Concepts and Artifacts
Marc-André d'Anjou1,2 and Dominique Penninck3
1 Centre Vétérinaire Rive-Sud, Brossard, Québec, Canada
2 Faculté de médecine vétérinaire de l'Université de Montréal, Saint-Hyacinthe, Québec, Canada
3 Department of Clinical Sciences, Cummings School of Veterinary Medicine, Tufts University, North Grafton, MA, USA
Fundamentals
Sound comprises a series of vibrations transmitted through an elastic solid, a liquid, or a gas. Sound waves have variable wavelengths and amplitudes, with a frequency defined as being the number of cycles repeated over a given time interval. A high-frequency sound, therefore, has a shorter wavelength and more cycles per second (cycles/s or Hz) than a low-frequency sound. The human ear can perceive sounds in the range of 20–20,000 cycles/s, or up to 20 kHz (Hangiandreou 2003). Beyond this range, it is called “ultrasound.” Ultrasound frequencies used in medical imaging generally vary between 3 and 12 MHz, or 3–12 million cycles/s, which is well beyond what the human ear can perceive.
Electronic linear probes are equipped with a row of piezoelectric crystals whose alignment varies from flat (or linear) to convex. The material contained in each one is deformed when it receives an electrical charge, and emits a vibration—this is the initial ultrasound pulsation. The ultrasound wave travels through the tissues, generating several returning waves- or echoes-that, upon reaching the probe, make the crystals vibrate again, producing a new electric current that travels to the system's computer and provides information on each of the reflected waves. The set of all the reflected waves creates the ultrasound image.
To produce an image, the first piezoelectric crystals are stimulated to generate a short ultrasound pulse—comprising three to four waves—that travels through tissue interfaces to produce thousands of echoes that are sent back to the probe (Figure 1.1). Shortly afterward, a new ultrasound pulse leaves the probe at a different angle, generating a new set of echoes that return to the second series of crystals. Assuming a constant wave propagation speed of 1,540 m/s in soft tissues, each of these echoes can be located precisely along the trajectory, depending on the time interval between the departing wave and the returning echo (Hangiandreou et al. 2003). Hundreds of wave lines are produced this way, scanning tissues at high speed to produce over 30 images/s, each one containing thousands of pixels describing the acoustic characteristics of the scanned tissues.
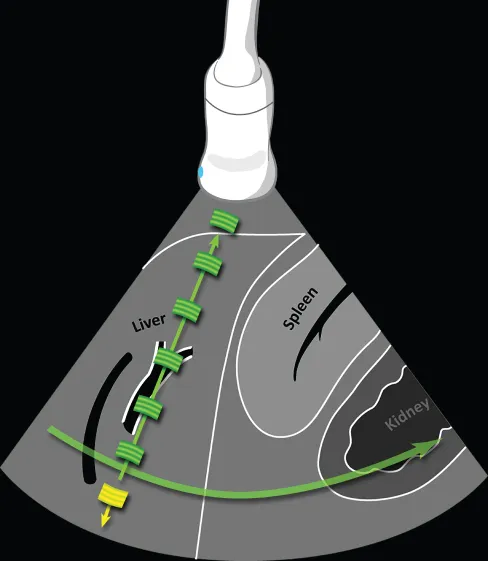
Figure 1.1 Ultrasound propagation and image formation. Each ultrasound image is formed by the addition of hundreds of individual scan lines. Each line is produced after a single ultrasound pulse (in yellow) is emitted by the transducer. As this pulse propagates through soft tissues, many echoes (in green) are generated at interfaces of different acoustic impedance (such as hepatocytes–connective tissue), producing an image of variable echogenicity and echotexture. Each echo is anatomically localized based on the time interval between the emitted pulse and its reception. After a specific time, a new pulse is emitted along an adjacent line, producing an additional scan line. Scan lines are generated very rapidly and successively, producing 15–60 images/s, allowing “real time” ultrasonography.
Tissue acoustic characteristics are defined by the acoustic impedance, which dictates their level of ultrasound reflection and thus their echogenicity. Impedance is the product of the speed of ultrasound waves through a given tissue multiplied by its density (Table 1.1) (Bushberg 2011). Ultrasound wave reflection is stronger at interfaces of tissues that greatly differ in acoustic impedance, and weaker when traversing an interface of tissues with similar acoustic impedances. Mild variations in acoustic impedance are desirable for tissue examination, resulting in variable echogenicity and echotexture, which allow internal architectures to be compared. In fact, not only does the ultrasound system locate the origin of each echo, it also measures its intensity, which is expressed in terms of pixel brightness on the unit monitor (B mode).
Table 1.1 Density and speed of sound in materials and biological tissues and resulting acoustic impedance
Source: Bushberg et al. (2011).
| Material or tissue | Density (kg/m3) | Speed (m/s) | Acoustic impedance |
| Air | 1.2 | 330 | 0.0004 × 10⁶ |
| Lung | 300 | 600 | 0.18 × 10⁶ |
| Fat | 924 | 1,450 | 1.34 × 10⁶ |
| Water | 1,000 | 1,480 | 1.48 × 10⁶ |
| Soft tissues (in general) | 1,050 | 1,540 | 1.62 × 10⁶ |
| Liver | 1,061 | 1,555 | 1.65 × 10⁶ |
| Kidney | 1,041 | 1,565 | 1.63 × 10⁶ |
| Skull bone | 1,912 | 4,080 | 7.8 × 10⁶ |
Normal tissue echogenicity, which varies among organs and structures (Figure 1.2), and damaged tissue with altered acoustic characteristics can be compared. Normal and abnormal structures can be defined in terms of echogenicity as hypoechoic or hyperechoic to their normal state, or to other structures with which they are compared. Fluids without cells or large particles are anechoic (i.e., totally black) because of the absence of reflectors.
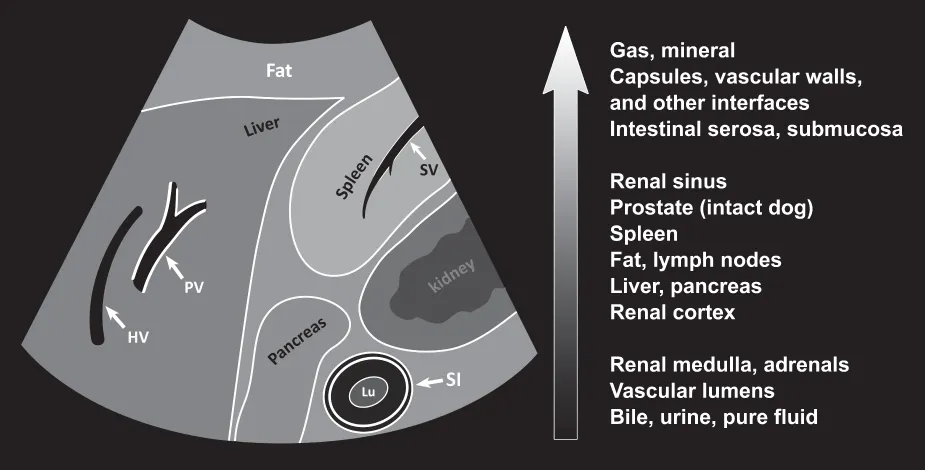
Figure 1.2 Relative echogenicity of tissues and other materials. Structures can be recognized and differentiated by their echogenicity. This figure illustrates the relative echogenicity of normal abdominal structures in dogs and cats. Note that the walls of the portal vein (PV) are hyperechoic even when...
Table of contents
- Cover
- Table of Contents
- Preface
- CHAPTER ONE: Practical Physical Concepts and Artifacts
- CHAPTER TWO: Eye and Orbit
- CHAPTER THREE: Neck
- CHAPTER FOUR: Thorax
- CHAPTER FIVE: Heart
- CHAPTER SIX: Liver
- CHAPTER SEVEN: Spleen
- CHAPTER EIGHT: Gastrointestinal Tract
- CHAPTER NINE: Pancreas
- CHAPTER TEN: Kidneys and Ureters
- CHAPTER ELEVEN: Bladder and Urethra
- CHAPTER TWELVE: Adrenal Glands
- CHAPTER THIRTEEN: Female Reproductive Tract
- CHAPTER FOURTEEN: Male Reproductive Tract
- CHAPTER FIFTEEN: Abdominal Cavity, Lymph Nodes, and Great Vessels
- CHAPTER SIXTEEN: Clinical Applications of Contrast Ultrasound
- CHAPTER SEVENTEEN: Musculoskeletal System
- CHAPTER EIGHTEEN: Spine and Peripheral Nerves
- Index
- End User License Agreement