Solutions Manual to Accompany Models for Life
eBook - ePub

Solutions Manual to Accompany Models for Life

An Introduction to Discrete Mathematical Modeling with Microsoft Office Excel

  1. English
  2. ePUB (mobile friendly)
  3. Available on iOS & Android
eBook - ePub

Solutions Manual to Accompany Models for Life

An Introduction to Discrete Mathematical Modeling with Microsoft Office Excel

Book details
Book preview
Table of contents
Citations

About This Book

A solutions manual to accompany An Introduction to Discrete Mathematical Modeling with Microsoft ® Office Excel ®

With a focus on mathematical models based on real and current data, Models for Life: An Introduction to Discrete Mathematical Modeling with Microsoft ® Office Excel ® guides readers in the solution of relevant, practical problems by introducing both mathematical and Excel techniques.

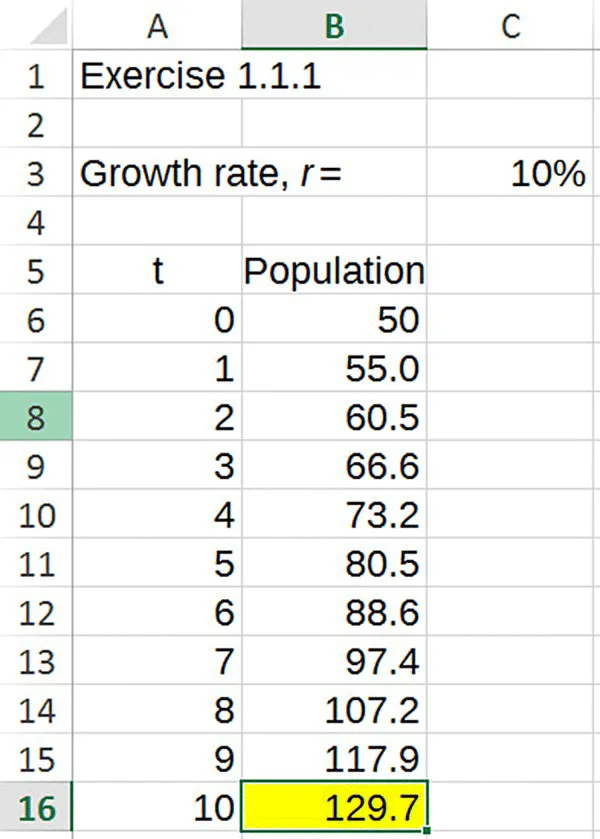
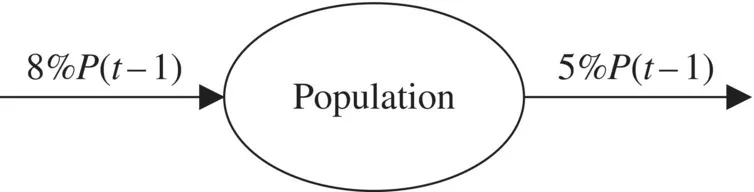
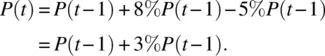
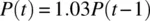
The book begins with a step-by-step introduction to discrete dynamical systems, which are mathematical models that describe how a quantity changes from one point in time to the next. Readers are taken through the process, language, and notation required for the construction of such models as well as their implementation in Excel. The book examines single-compartment models in contexts such as population growth, personal finance, and body weight and provides an introduction to more advanced, multi-compartment models via applications in many areas, including military combat, infectious disease epidemics, and ranking methods. Models for Life: An Introduction to Discrete Mathematical Modeling with Microsoft ® Office Excel ® also features:

  • A modular organization that, after the first chapter, allows readers to explore chapters in any order
  • Numerous practical examples and exercises that enable readers to personalize the presented models by using their own data
  • Carefully selected real-world applications that motivate the mathematical material such as predicting blood alcohol concentration, ranking sports teams, and tracking credit card debt
  • References throughout the book to disciplinary research on which the presented models and model parameters are based in order to provide authenticity and resources for further study
  • Relevant Excel concepts with step-by-step guidance, including screenshots to help readers better understand the presented material
  • Both mathematical and graphical techniques for understanding concepts such as equilibrium values, fixed points, disease endemicity, maximum sustainable yield, and a drug's therapeutic window
  • A companion website that includes the referenced Excel spreadsheets, select solutions to homework problems, and an instructor's manual with solutions to all homework problems, project ideas, and a test bank

Frequently asked questions

Simply head over to the account section in settings and click on “Cancel Subscription” - it’s as simple as that. After you cancel, your membership will stay active for the remainder of the time you’ve paid for. Learn more here.
At the moment all of our mobile-responsive ePub books are available to download via the app. Most of our PDFs are also available to download and we're working on making the final remaining ones downloadable now. Learn more here.
Both plans give you full access to the library and all of Perlego’s features. The only differences are the price and subscription period: With the annual plan you’ll save around 30% compared to 12 months on the monthly plan.
We are an online textbook subscription service, where you can get access to an entire online library for less than the price of a single book per month. With over 1 million books across 1000+ topics, we’ve got you covered! Learn more here.
Look out for the read-aloud symbol on your next book to see if you can listen to it. The read-aloud tool reads text aloud for you, highlighting the text as it is being read. You can pause it, speed it up and slow it down. Learn more here.
Yes, you can access Solutions Manual to Accompany Models for Life by Jeffrey T. Barton in PDF and/or ePUB format, as well as other popular books in Mathematics & Mathematics General. We have over one million books available in our catalogue for you to explore.

Information

Publisher
Wiley
Year
2016
ISBN
9781119040088
Edition
1

1
DENSITY INDEPENDENT POPULATION MODELS

1.1 EXPONENTIAL GROWTH

  1. Consider the flow diagram in Text Figure 1.21.
    Screenshot of an Excel setup for Example 1.10 in Exercise 1.3.9 with a Goal Seek dialog box setting cell B8 to value 3,000,000 by changing cell C4.
    Text Figure 1.21 Flow diagram for Exercise 1.1.1.
    1. Find the corresponding DDS.
      The flow diagram tells us how the population changes from one year to the next. Inward pointing arrows represent additions while outward pointing arrows represent subtractions. Here there is only one arrow, and it represents an addition. Thus the DDS is given by
      images
      We can also write the DDS as
      images
      , or
      images
      .
    2. Use a calculator to predict the population after 2 years if
      images
      .
      If
      images
      , then by using the DDS we can predict the population 1 year later:
      images
      Applying the DDS once more gives us the model prediction for year 2:
      images
      After 2 years we predict the population will be 60.5.
    3. Use Excel to project the population in year 10.
      Since the model in this problem is the exponential growth model, we can save time by using the same spreadsheet we created for the Yellowstone grizzly population. We only need to change the growth rate to
      images
      and the initial population to
      images
      . Figure 1.1 shows the result with the projection for year 10 highlighted. The model predicts a population of about 129.7 in year 10.
      Screenshot of an Excel output for Exercise 1.1.1 displaying a table listing population in each year for 10 years with a growth rate of 10%, from 50 (t = 0) to 129.7 (t = 10).
      Figure 1.1 Excel output for Exercise 1.1.1.
  2. Consider the flow diagram in Text Figure 1.23.
    Screenshot of an Excel confirmation for Exercise 1.5.1 with two columns, t and P(t). The formula =B4+0.05*B4-10 is input on cell B5.
    Text Figure 1.23 Flow diagram for Exercise 1.1.3.
    1. Find the corresponding DDS.
      The flow diagram tells us how the population changes from one year to the next. Inward pointing arrows represent additions while outward pointing arrows represent subtractions. Here we have two arrows: one an addition and one a subtraction. Thus the DDS is given by
      images
      We can also write the DDS as
      images
      , or
      images
      .
    2. Use a calculator to predict the population after 2 years if
      images
      .
      If
      images
      , then by using the DDS we can predict the population 1 year late...

Table of contents

  1. Cover
  2. Title Page
  3. Table of Contents
  4. PREFACE
  5. ABOUT THE COMPANION WEBSITE
  6. 1 DENSITY INDEPENDENT POPULATION MODELS
  7. 2 PERSONAL FINANCE
  8. 3 COMBAT MODELS
  9. 4 THE SPREAD OF INFECTIOUS DISEASES
  10. 5 DENSITY DEPENDENT POPULATION MODELS
  11. 6 BLOOD ALCOHOL CONCENTRATION AND PHARMACOKINETICS
  12. 7 RANKING METHODS
  13. 8 BODY WEIGHT AND BODY COMPOSITION
  14. End User License Agreement